Do weekly jobless claims move Treasury yields?
Initial jobless claims arrive every Thursday at 8:30 a.m. Eastern — the most frequent piece of hard labor-market data on the calendar. Because it is timely and weekly, it gets a lot of screen time, and a surprising claims number is often blamed for a day's move in yields. But weekly data is also noisy. We tested whether jobless-claims days genuinely move the 10-year Treasury, and with 150 releases in the sample, this is one of our most statistically powerful tests.
Verdict
- Direction (release day): Not Significant
- Volatility (release day): Not Significant
- Volatility (5 days): Not Significant
Despite the weekly attention, jobless-claims days move the 10-year Treasury about as much as a normal day (1.15×, not significant) — and with 150 releases tested, that is a confident 'no'.
Bottom line: Weekly jobless claims are high-frequency noise — markets mostly shrug. The monthly jobs report is a different story.
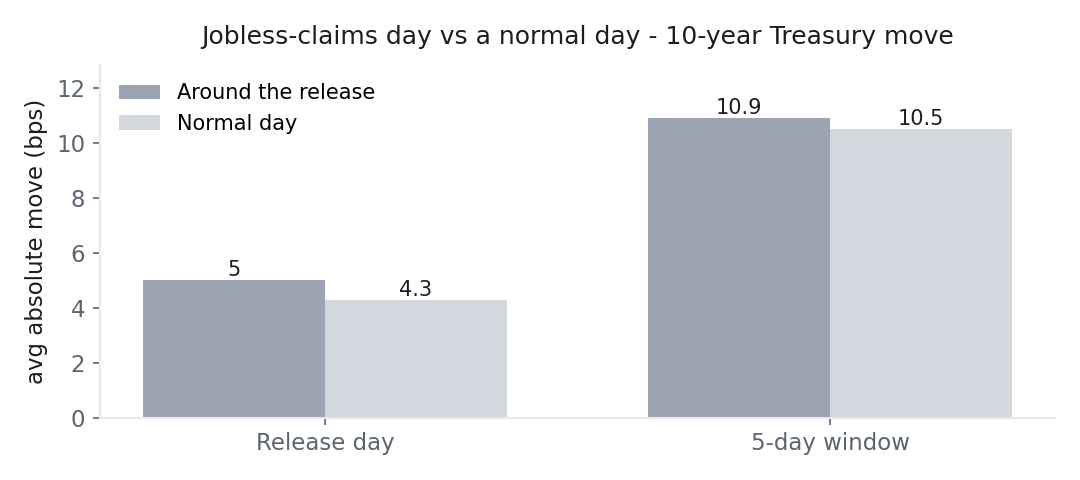
Average absolute 10-year yield move around weekly jobless-claims releases versus normal days (N=150). Chart: Macro or Noise, from Federal Reserve Board data via FRED (public domain).
What the numbers say
On release day, the 10-year yield moved about 5.0 basis points versus 4.3 on a normal day — roughly 1.15× a normal day, which does not clear the significance bar (p=0.05, on the not-significant side). Direction is a wash (about +0.5 basis points, p=0.28), and there is no elevation over a five-day window.
One honest wrinkle: further along the curve, the 5-year does clear p<0.05 on its own (×1.17, p=0.04). We do not call that a finding, because it does not survive correction once you account for every release-and-market pair we test — and a single nominal hit among nine markets is what chance looks like. It is in the full grid either way, labelled for what it is.
The important thing here is why the "not significant" verdict is strong rather than weak.
Why 150 releases makes this a confident "no"
With most of our monthly tests, a null result comes with a caveat about statistical power — maybe the effect is real but the sample is too small to see. That caveat does not apply here. Jobless claims are weekly, so we have 150 observations, several times more than any other release we study. When a test with that much data still cannot distinguish release-day moves from normal days, the null is informative: it is not "we couldn't tell," it is "we looked closely, and there is no meaningful effect to find." A confident null is a real result, and this is one of the cleanest ones on the site.
The contrast with the monthly jobs report
It is worth holding this next to the monthly jobs report, which is the single biggest scheduled mover of Treasury yields (about 2× a normal day). Same broad topic — the labor market — completely different market impact. The difference is information density: the monthly payrolls report is a comprehensive, heavily-anticipated snapshot, while weekly claims are a small, noisy update that rarely changes the bigger picture. Frequency and attention are not the same as market-moving power.
What this means in practice
- Jobless-claims day is not a bond event. On strong evidence, it moves the 10-year about like a normal day.
- This null is trustworthy, not tentative. 150 releases is enough to say so with confidence.
- The monthly jobs report is the labor release that matters for bonds — not the weekly one.
None of this is advice — it is a description of what 150 releases actually did, and results can change with a different sample, period, or definition.
The data
| Dimension | Horizon | Value | Baseline | Test stat | p-value | Verdict |
|---|---|---|---|---|---|---|
| Direction | release day | 0.5 bps | 0.0 bps | 1.09 | 0.280 | Not Significant |
| Volatility | release day | 5.0 bps | 4.3 bps | 1.15 | 0.050 | Not Significant |
| Volatility | 5 days | 10.9 bps | 10.5 bps | 1.04 | 0.330 | Not Significant |
Methodology
- Events (N): 150 weekly jobless-claims releases.
- Window: 2023-01-05 → 2025-12-31.
- Measurement: change in the 10-year yield from the prior close to the close at the end of the holding window (look-ahead protected).
- Baseline: the unconditional distribution of same-length moves across all trading days.
- Tests: one-sample t-test of the signed move against zero (direction), and a bootstrap of the absolute move against the baseline (size).
Caveats
- Weekly release (others here are monthly); the 5-day windows overlap.
- Surprise-versus-forecast conditioning is not applied — only the release-day reaction is measured.
- Historical statistics for informational purposes only, not financial advice. Results may vary with sample, period, and baseline definition.
Related tests
- Do jobs reports (NFP) move Treasury yields? — the monthly labor release, and a completely different result.
- Do retail sales move Treasury yields? — another second-tier read.
- Which U.S. data releases move the Treasury curve? — the full ranking.
Source
- 10-Year Treasury Constant Maturity, Federal Reserve Board via FRED (Tier A, U.S. public domain) — DGS10.
- Weekly jobless-claims release dates, U.S. Department of Labor — Unemployment Insurance Weekly Claims.