Do jobs reports (NFP) move Treasury yields?
Most similar past releases: August 2010, January 2008, March 2013
Reported figure: U.S. government release. Market move: change from the prior close, Federal Reserve Board data via FRED. "Normal day" is that calendar year's average daily move. Browse every release.
The monthly U.S. jobs report — the Employment Situation, known to traders by its headline line, nonfarm payrolls (NFP) — is often called the most important number on the economic calendar. It lands at 8:30 a.m. Eastern on the first Friday of most months, and desks staff up for it. The reasoning is that jobs drive the Fed: a strong labor market lets the Fed keep policy tight, a weak one pushes it toward cuts, and Treasury yields are supposed to swing accordingly.
So of all the releases we test, the jobs report is the one where a large, directional bond-market reaction seems most likely. We measured the 10-year Treasury yield's reaction across 36 consecutive jobs-report days from 2023 to 2025, compared against a baseline of ordinary trading days. The result confirms half of the intuition and dismantles the other half.
Verdict
- Direction (release day): Not Significant
- Volatility (release day): Significant
- Volatility (5 days): Not Significant
On U.S. jobs-report days, the 10-year Treasury yield swings about 2× a normal day (p<0.001) — the biggest scheduled move of the macro releases we have tested. But the direction is unpredictable (p=0.55).
Bottom line: The jobs report is the single biggest scheduled day for bond volatility — but you still cannot predict which way yields go.
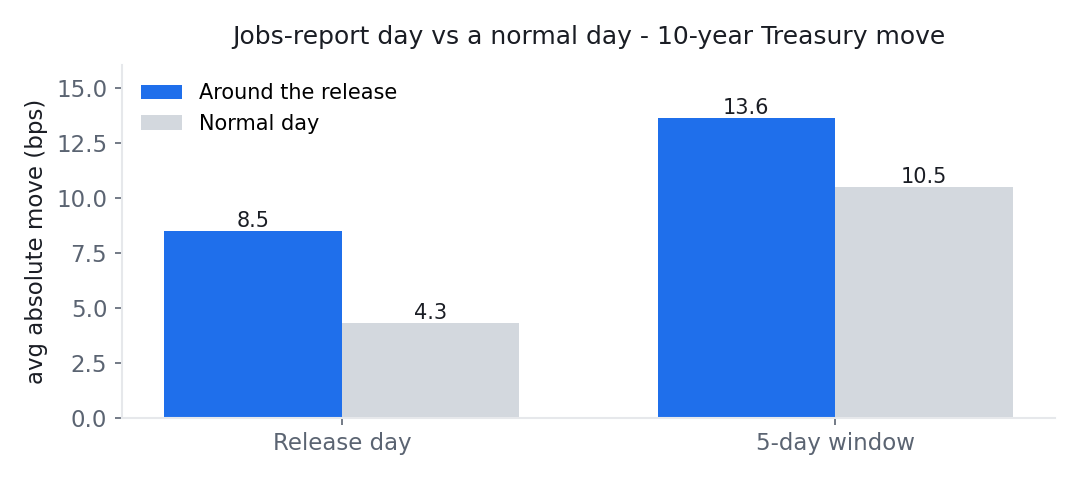
Average absolute 10-year yield move around jobs reports versus normal days (N=36). Chart: Macro or Noise, from Federal Reserve Board data via FRED (public domain).
What the numbers say
On release day, the 10-year yield moved about 8.5 basis points in absolute terms, versus roughly 4.3 on a normal day — close to twice a normal day, and the largest release-day reaction of any macro report in our set. That gap is highly significant (p<0.001). The bond market unquestionably pays attention to the jobs report.
The direction, however, is a coin flip. The average signed move was about +1.0 basis point with a p-value of 0.55 — statistically indistinguishable from zero. Strong-jobs surprises and weak-jobs surprises push yields opposite ways, and over 36 reports they cancel out. Knowing that a jobs report is coming tells you the market will move; it does not tell you which way.
The reaction is also sharply concentrated in time. By five trading days out, the volatility bump has largely faded (about 1.3× a normal week, no longer significant). Whatever the jobs report does to bonds, it does on the day.
The front end reacts even harder
One detail worth pulling out: the effect is largest at the short, rate-sensitive end of the curve. The 2-year Treasury — the maturity most tied to near-term Fed expectations — moves about 2.35× a normal day on jobs-report days, even more than the 10-year. That fits the mechanism: the jobs number matters because of what it implies for Fed policy, and policy expectations live at the front of the curve. You can see how this compares across every maturity on our Treasury curve map.
What this means in practice
- Expect the biggest scheduled move of the month — direction unknown. If you hold anything sensitive to yields, the jobs report is the release most likely to move it, and the least predictable in direction.
- "Strong payrolls, so yields up" is not supported. The average jobs-day direction is indistinguishable from zero. A confident directional call from the headline is describing a pattern our 36-report sample does not find.
- It is a release-day event. A week later, the volatility edge is essentially gone.
None of this is advice — it is a description of what 36 reports actually did, and results can change with a different sample, period, or definition.
Key findings, generated from the data
- Across 326 releases, the 10Y moved an average of 6.20 bps on release day (absolute).
- The largest single reaction was +24.0 bps on 2004-04-02 (March 2004 data).
- Pooled across all 326 releases since 2000, readings above trend moved the 10Y +1.9 bps versus -0.3 bps below trend (p=0.013). But that pooled result does not reproduce across eras — 2000-2012: +3.46 (p=0.01); 2013-2019: +2.39 (p=0.07); 2020-2026: -0.54 (p=0.77). It is concentrated in one period rather than being a stable relationship, so we report it as regime-dependent, not established.
- Because our surprise is a trend proxy rather than a market consensus, and because these splits are sensitive to the period chosen, treat all of the above as patterns observed in this sample rather than as established effects.
- Surprise size does not clearly scale the reaction: the largest third of surprises averaged 6.44 versus 6.11 for the smallest third (p=0.61).
Generated automatically from our event database by a rule-based script (no language model). "Surprise" is model-based — the reading minus the average of the previous three — and is not a market consensus forecast. See every release in the database.
The data
| Dimension | Horizon | Value | Baseline | Test stat | p-value | Verdict |
|---|---|---|---|---|---|---|
| Direction | release day | 1.0 bps | 0.0 bps | 0.61 | 0.545 | Not Significant |
| Volatility | release day | 8.5 bps | 4.3 bps | 1.97 | <0.001 | Significant (robust) |
| Volatility | 5 days | 13.6 bps | 10.5 bps | 1.30 | 0.055 | Not Significant |
Methodology
- Events (N): 36 jobs reports.
- Window: 2023-01-06 → 2025-12-16.
- Measurement: change in the 10-year yield from the prior close to the close at the end of the holding window (look-ahead protected).
- Baseline: the unconditional distribution of same-length moves across all trading days.
- Tests: one-sample t-test of the signed move against zero (direction), and a bootstrap of the absolute move against the baseline (size).
Caveats
- The rate-sensitive 2-year Treasury reacts even more strongly on jobs-report days (~2.35× a normal day).
- The event study above does not condition on surprise: it measures the reaction to the release itself. The "Key findings" block does add a split by our own trend-based proxy, which is not a market consensus forecast — consensus data is proprietary and outside our public-domain sources.
- Two late-2025 reports were delayed by the federal government shutdown but are included on their actual release dates.
- Historical statistics for informational purposes only, not financial advice. Results may vary with sample, period, and baseline definition.
Related tests
- Does CPI move the 10-year Treasury yield? — the other big inflation-and-rates day.
- Does a Fed rate decision move Treasury yields? — the policy meeting itself.
- Which U.S. data releases move the Treasury curve? — where the jobs report ranks across maturities.
Source
- 10-Year Treasury Constant Maturity, Federal Reserve Board via FRED (Tier A, U.S. public domain) — DGS10.
- Employment Situation (jobs report) release dates, U.S. Bureau of Labor Statistics — Employment Situation.