What Actually Happened: the U.S. economic release database
Most sites tell you when a number is coming out. A few tell you what the number was. Almost none tell you what the market actually did when it landed — release by release, in a table you can scan or download whole.
That is what this page is. 1,667 releases — every CPI, PPI, jobs report, PCE and retail-sales release since 2000 — with:
- Actual — the figure the agency published (BLS, BEA, Census).
- Previous — the prior month's reading, on the same basis.
- Surprise — how far the reading came in from its own recent trend (see the honest caveat below).
- Market reaction — the measured move in the 2-year and 10-year Treasury yield and the broad dollar on release day, plus how that compares to a normal day for that year.
- Larger than — where that reaction ranks against every other release of the same kind since 2000. "Larger than 14%" means it was one of the quietest; "larger than 95%" means only one release in twenty moved more.
Everything here is computed by us from U.S. government public-domain series. Nothing is copied from a data vendor. The tables below show the most recent 60 of each release; the full 1,667-row CSV is a free download.
Each release also gets two charts drawn from its whole history: where the moves landed (a distribution, so you can see the spread and how close the average sits to zero) and surprise against the move on the day (a scatter, so you can see for yourself that a bigger surprise does not buy you a bigger move). These use the full 2000-onward sample, which is wider than the 2023–2025 window the individual write-ups test — so the sample sizes differ from theirs by design.
A note on the "vs normal" column: a normal day in 2013 and a normal day in 2023 are not the same thing, so the ratio is computed against the average daily move in that same calendar year. Otherwise the zero-rate 2010s would make every recent release look enormous. The "larger than" column does the opposite — it ranks the raw move against the whole 2000-onward history, unadjusted. That is why a release can be quieter than a normal day for its own year and still sit mid-pack against 25 years of history: the year itself was a loud one.
The latest releases at a glance
CPI — latest release
July 2026 data, published 2026-08-12. Reported 3.36% (-0.50 vs its 3-reading trend). The 10Y moved -2.0 bps that day, ×0.58 a normal day for that year — larger than 35% of all 338 releases since 2000.
Past releases with the most similar surprise:
| Release date | Data for | Actual | Surprise | 10Y | vs normal |
|---|---|---|---|---|---|
| 2006-04-19 | March 2006 | 3.36 | -0.50 | +5.0 | ×1.7 |
| 2024-09-11 | August 2024 | 2.53 | -0.51 | +0.0 | ×0.0 |
| 2025-04-10 | March 2025 | 2.39 | -0.51 | +6.0 | ×1.52 |
| 2001-09-18 | August 2001 | 2.72 | -0.48 | +9.0 | ×1.64 |
| 2009-04-15 | March 2009 | -0.38 | -0.48 | +2.0 | ×0.3 |
PPI — latest release
July 2026 data, published 2026-08-13. Reported 4.66% (-1.03 vs its 3-reading trend). The 2Y moved -5.0 bps that day, ×1.35 a normal day for that year — larger than 79% of all 336 releases since 2000.
Past releases with the most similar surprise:
| Release date | Data for | Actual | Surprise | 2Y | vs normal |
|---|---|---|---|---|---|
| 2025-05-15 | April 2025 | 2.40 | -1.05 | -9.0 | ×2.32 |
| 2020-06-11 | May 2020 | -0.93 | -0.99 | +2.0 | ×1.07 |
| 2022-12-09 | November 2022 | 7.37 | -1.08 | +2.0 | ×0.33 |
| 2019-02-12 | January 2019 | 1.92 | -0.91 | +2.0 | ×0.59 |
| 2015-04-14 | March 2015 | -0.81 | -0.90 | -1.0 | ×0.39 |
NFP (jobs) — latest release
July 2026 data, published 2026-08-07. Reported -23.00k jobs (-100.00 vs its 3-reading trend). The 10Y moved -4.0 bps that day, ×1.16 a normal day for that year — larger than 44% of all 326 releases since 2000.
Past releases with the most similar surprise:
| Release date | Data for | Actual | Surprise | 10Y | vs normal |
|---|---|---|---|---|---|
| 2010-09-03 | August 2010 | 0.00 | -98.33 | +9.0 | ×1.75 |
| 2008-02-01 | January 2008 | -4.00 | -102.67 | -5.0 | ×0.72 |
| 2013-04-05 | March 2013 | 143.00 | -97.33 | -6.0 | ×1.63 |
| 2018-10-05 | September 2018 | 81.00 | -97.33 | +4.0 | ×1.47 |
| 2017-04-07 | March 2017 | 124.00 | -97.00 | +4.0 | ×1.44 |
PCE — latest release
July 2026 data, published 2026-08-26. Reported 3.70% (-0.18 vs its 3-reading trend). The USD moved +0.2 % that day, ×0.86 a normal day for that year — larger than 52% of all 331 releases since 2000.
Past releases with the most similar surprise:
| Release date | Data for | Actual | Surprise | USD | vs normal |
|---|---|---|---|---|---|
| 2013-01-31 | December 2012 | 1.62 | -0.17 | -0.1 | ×0.47 |
| 2013-03-01 | February 2013 | 1.60 | -0.17 | +0.3 | ×1.82 |
| 2014-03-03 | February 2014 | 1.09 | -0.17 | +0.3 | ×1.84 |
| 2009-08-17 | July 2009 | -1.47 | -0.19 | +0.7 | ×1.71 |
| 2014-09-29 | August 2014 | 1.51 | -0.19 | +0.1 | ×0.99 |
Retail sales — latest release
July 2026 data, published 2026-08-14. Reported -0.58% (-1.20 vs its 3-reading trend). The 10Y moved +5.0 bps that day, ×1.45 a normal day for that year — larger than 62% of all 342 releases since 2000.
Past releases with the most similar surprise:
| Release date | Data for | Actual | Surprise | 10Y | vs normal |
|---|---|---|---|---|---|
| 2008-10-15 | September 2008 | -1.54 | -1.21 | -4.0 | ×0.58 |
| 2014-02-13 | January 2014 | -0.78 | -1.17 | -7.0 | ×2.23 |
| 2025-05-15 | April 2025 | -0.12 | -1.23 | -8.0 | ×2.03 |
| 2019-10-16 | September 2019 | -0.64 | -1.15 | -2.0 | ×0.59 |
| 2000-12-13 | November 2000 | -0.55 | -1.13 | -7.0 | ×1.72 |
An honest note on "Surprise"
The number labelled Surprise is not a market consensus forecast. Consensus estimates — the "economists expected 3.1%" figure you see in the press — are proprietary products sold by financial data vendors, and we do not license them, so we do not use them.
Instead we compute a transparent, reproducible alternative: the reading minus the average of the previous three readings. It measures whether a release came in above or below its own recent trend. We label it plainly rather than borrow someone else's number.
What the pooled sample shows — and why we do not stop there
Pooled across all releases since 2000, two of the five show a directional pattern that survives correction for testing five releases at once:
| Release | Above trend | Below trend | p (pooled) |
|---|---|---|---|
| Jobs report → 10Y | +1.89 bps | −0.31 bps | 0.010 |
| Retail sales → 10Y | +1.10 bps | −0.89 bps | 0.006 |
| CPI → 10Y | −0.87 bps | −0.13 bps | 0.319 |
| PPI → 2Y | −0.26 bps | −1.13 bps | 0.150 |
| PCE → dollar | −0.02% | +0.01% | 0.546 |
A pooled p-value is easy to over-read, so we ran the obvious follow-up: does it reproduce if you split the sample by era?
It does not. The pattern is regime-dependent.
| Release | 2000–2012 | 2013–2019 | 2020–2026 |
|---|---|---|---|
| Jobs report → 10Y | +3.46 (p=0.008) | +2.39 (p=0.07) | −0.33 (p=0.86) |
| Retail sales → 10Y | +2.71 (p=0.014) | +0.12 (p=0.92) | +2.31 (p=0.14) |
| CPI → 10Y | −1.87 (p=0.10) | −1.76 (p=0.06) | +2.46 (p=0.15) |
(Gap = average move after an above-trend reading minus the average after a below-trend reading, in basis points.)
Read that carefully:
- The pooled significance is carried by 2000–2012. That is the only era where either result is significant on its own.
- In 2020–2026 the jobs-report effect is gone, and the sign is slightly reversed.
- CPI's sign flips between the earlier eras and the 2020s.
So the honest statement is not "the effect exists." It is: in the extended sample, an above-trend jobs or retail reading was followed by higher yields — but that pattern is concentrated in 2000–2012 and does not reproduce in the most recent period. Whether that reflects a genuine change in how markets process data, or simply noise in shorter sub-samples, we cannot tell from this alone.
For a reader, the regime split is arguably the more useful output: a relationship that worked in one era and not the next is exactly the kind of thing that gets quietly assumed to be permanent.
What we are careful not to claim
- Not that surprises "do" or "do not" predict direction. Our surprise is a trend proxy, not a market consensus — it counts the predictable part of a reading as if it were news, which pushes any measured relationship toward zero. Research using licensed consensus forecasts generally finds stronger effects than anything we can show here.
- Not that a longer sample "fixed" anything. Extending to 2000 changed the sample period, the policy regimes, the rate environment and the baseline method all at once — not just the number of observations. Any of those could drive the difference.
- Only this: patterns observed in this sample, with the periods and definitions stated.
And note what is unaffected. The site's core finding concerns the unconditional release-day move — knowing only that CPI prints today, you cannot predict the direction. That holds throughout, and is consistent with everything above: above- and below-trend surprises arrive in roughly equal numbers and cancel out in the average.
The database
Jump to: CPI · PPI · Jobs report · PCE · Retail sales
CPI (338 releases since 2000 · Headline CPI, 12-month change)
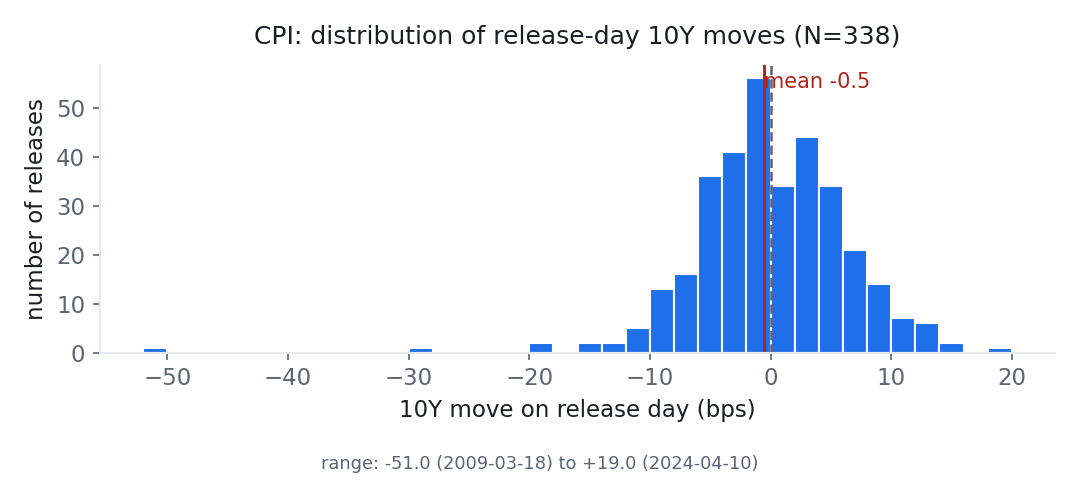
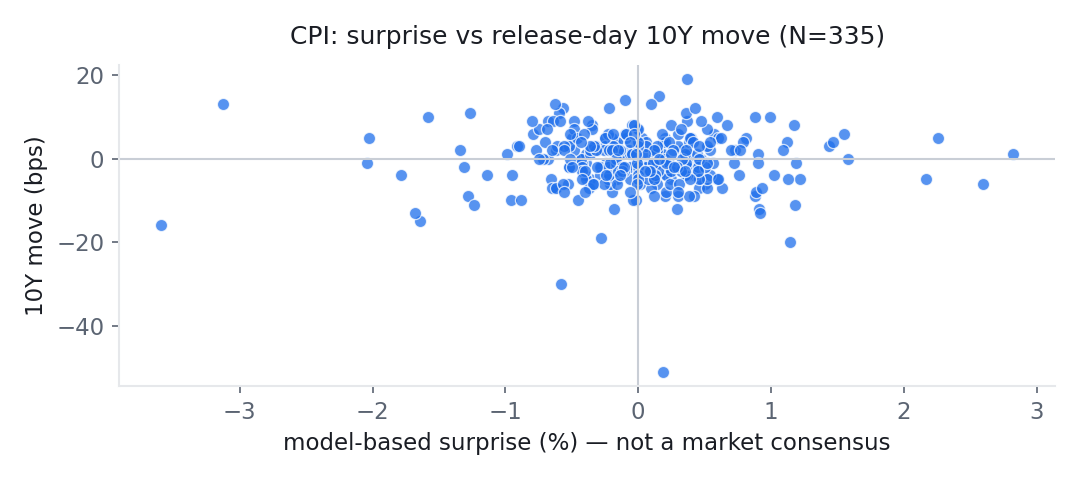
Showing the 60 most recent of 338 releases (2000-01-14 to 2026-08-12). Download all 338 as CSV.
| Release date | Data for | Actual (%) | Previous | Surprise | 2Y | 10Y | USD | 10Y vs normal | Larger than |
|---|---|---|---|---|---|---|---|---|---|
| 2026-08-12 | July 2026 | 3.36 | 3.53 | -0.50 | -2.0 | -2.0 | -0.05% | ×0.58 | 35% |
| 2026-07-14 | June 2026 | 3.53 | 4.25 | -0.24 | -8.0 | -4.0 | -0.22% | ×1.16 | 57% |
| 2026-06-10 | May 2026 | 4.25 | 3.81 | +1.09 | +0.0 | +2.0 | -0.04% | ×0.58 | 35% |
| 2026-05-12 | April 2026 | 3.81 | 3.26 | +1.12 | +5.0 | +4.0 | +0.40% | ×1.16 | 57% |
| 2026-04-10 | March 2026 | 3.26 | 2.41 | +0.77 | +3.0 | +2.0 | -0.04% | ×0.58 | 35% |
| 2026-03-11 | February 2026 | 2.41 | 2.39 | -0.19 | +7.0 | +6.0 | +0.47% | ×1.74 | 76% |
| 2026-02-13 | January 2026 | 2.39 | 2.68 | -0.42 | -7.0 | -5.0 | -0.01% | ×1.45 | 68% |
| 2026-01-13 | December 2025 | 2.68 | 2.74 | -0.21 | -1.0 | -1.0 | +0.12% | ×0.29 | 18% |
| 2025-12-18 | November 2025 | 2.74 | — | -0.14 | -3.0 | -4.0 | -0.09% | ×1.01 | 57% |
| 2025-10-24 | September 2025 | 3.01 | 2.92 | +0.25 | +0.0 | +1.0 | -0.02% | ×0.25 | 18% |
| 2025-09-11 | August 2025 | 2.92 | 2.70 | +0.35 | -2.0 | -3.0 | -0.14% | ×0.76 | 45% |
| 2025-08-12 | July 2025 | 2.70 | 2.67 | +0.26 | -4.0 | +2.0 | -0.34% | ×0.51 | 35% |
| 2025-07-15 | June 2025 | 2.67 | 2.35 | +0.32 | +5.0 | +7.0 | +0.24% | ×1.77 | 81% |
| 2025-06-11 | May 2025 | 2.35 | 2.31 | -0.16 | -7.0 | -6.0 | -0.38% | ×1.52 | 76% |
| 2025-05-13 | April 2025 | 2.31 | 2.39 | -0.43 | +4.0 | +4.0 | -0.43% | ×1.01 | 57% |
| 2025-04-10 | March 2025 | 2.39 | 2.82 | -0.51 | -7.0 | +6.0 | -1.22% | ×1.52 | 76% |
| 2025-03-12 | February 2025 | 2.82 | 3.00 | -0.06 | +7.0 | +4.0 | -0.14% | ×1.01 | 57% |
| 2025-02-12 | January 2025 | 3.00 | 2.89 | +0.25 | +7.0 | +8.0 | -0.08% | ×2.03 | 85% |
| 2025-01-15 | December 2024 | 2.89 | 2.75 | +0.29 | -10.0 | -12.0 | -0.13% | ×3.04 | 96% |
| 2024-12-11 | November 2024 | 2.75 | 2.60 | +0.23 | +0.0 | +4.0 | -0.09% | ×0.89 | 57% |
| 2024-11-13 | October 2024 | 2.60 | 2.44 | -0.02 | -7.0 | +1.0 | +0.14% | ×0.22 | 18% |
| 2024-10-10 | September 2024 | 2.44 | 2.53 | -0.36 | -1.0 | +3.0 | +0.17% | ×0.67 | 45% |
| 2024-09-11 | August 2024 | 2.53 | 2.89 | -0.51 | +3.0 | +0.0 | -0.19% | ×0.0 | 4% |
| 2024-08-14 | July 2024 | 2.89 | 2.97 | -0.31 | +1.0 | -2.0 | -0.48% | ×0.45 | 35% |
| 2024-07-11 | June 2024 | 2.97 | 3.27 | -0.40 | -12.0 | -8.0 | -0.34% | ×1.79 | 85% |
| 2024-06-12 | May 2024 | 3.27 | 3.36 | -0.06 | -6.0 | -8.0 | -0.17% | ×1.79 | 85% |
| 2024-05-15 | April 2024 | 3.36 | 3.48 | +0.12 | -8.0 | -9.0 | -0.47% | ×2.01 | 90% |
| 2024-04-10 | March 2024 | 3.48 | 3.15 | +0.37 | +23.0 | +19.0 | +0.72% | ×4.24 | 99% |
| 2024-03-12 | February 2024 | 3.15 | 3.09 | -0.03 | +7.0 | +6.0 | +0.11% | ×1.34 | 76% |
| 2024-02-13 | January 2024 | 3.09 | 3.35 | -0.10 | +18.0 | +14.0 | +0.48% | ×3.12 | 98% |
| 2024-02-09 | January 2024 | 3.09 | 3.35 | -0.15 | +2.0 | +2.0 | -0.03% | ×0.45 | 35% |
| 2024-01-11 | December 2023 | 3.35 | 3.14 | -0.01 | -11.0 | -6.0 | +0.11% | ×1.34 | 76% |
| 2023-12-12 | November 2023 | 3.14 | 3.24 | -0.40 | +2.0 | -3.0 | -0.20% | ×0.5 | 45% |
| 2023-11-14 | October 2023 | 3.24 | 3.70 | -0.28 | -22.0 | -19.0 | -0.88% | ×3.14 | 99% |
| 2023-10-12 | September 2023 | 3.70 | 3.67 | +0.43 | +7.0 | +12.0 | +0.36% | ×1.98 | 96% |
| 2023-09-13 | August 2023 | 3.67 | 3.18 | +0.27 | -2.0 | -2.0 | -0.19% | ×0.33 | 35% |
| 2023-08-10 | July 2023 | 3.18 | 2.97 | -0.80 | +3.0 | +9.0 | -0.27% | ×1.49 | 90% |
| 2023-07-12 | June 2023 | 2.97 | 4.05 | -1.68 | -16.0 | -13.0 | -0.92% | ×2.15 | 97% |
| 2023-06-13 | May 2023 | 4.05 | 4.93 | -1.27 | +12.0 | +11.0 | -0.37% | ×1.82 | 94% |
| 2023-05-10 | April 2023 | 4.93 | 4.98 | -0.88 | -11.0 | -10.0 | -0.20% | ×1.65 | 93% |
| 2023-04-12 | March 2023 | 4.98 | 6.04 | -1.31 | -8.0 | -2.0 | -0.44% | ×0.33 | 35% |
| 2023-03-14 | February 2023 | 6.04 | 6.41 | -0.38 | +17.0 | +9.0 | +0.10% | ×1.49 | 90% |
| 2023-02-14 | January 2023 | 6.41 | 6.45 | -0.25 | +8.0 | +5.0 | -0.05% | ×0.83 | 68% |
| 2023-02-10 | January 2023 | 6.41 | 6.45 | -0.69 | +2.0 | +7.0 | +0.14% | ×1.16 | 81% |
| 2023-01-12 | December 2022 | 6.45 | 7.11 | -1.24 | -8.0 | -11.0 | -0.62% | ×1.82 | 94% |
| 2022-12-13 | November 2022 | 7.11 | 7.75 | -0.96 | -17.0 | -10.0 | -0.75% | ×1.59 | 93% |
| 2022-11-10 | October 2022 | 7.75 | 8.20 | -0.58 | -27.0 | -30.0 | -1.02% | ×4.76 | 100% |
| 2022-10-13 | September 2022 | 8.20 | 8.26 | -0.41 | +19.0 | +6.0 | -0.33% | ×0.95 | 76% |
| 2022-09-13 | August 2022 | 8.26 | 8.52 | -0.46 | +17.0 | +5.0 | +0.88% | ×0.79 | 68% |
| 2022-08-10 | July 2022 | 8.52 | 9.06 | -0.11 | -5.0 | -2.0 | -0.91% | ×0.32 | 35% |
| 2022-07-13 | June 2022 | 9.06 | 8.58 | +0.60 | +10.0 | -5.0 | -0.14% | ×0.79 | 68% |
| 2022-06-10 | May 2022 | 8.58 | 8.26 | +0.36 | +23.0 | +11.0 | +0.90% | ×1.75 | 94% |
| 2022-05-11 | April 2022 | 8.26 | 8.54 | +0.30 | +4.0 | -8.0 | -0.32% | ×1.27 | 85% |
| 2022-04-12 | March 2022 | 8.54 | 7.87 | +0.93 | -11.0 | -7.0 | -0.13% | ×1.11 | 81% |
| 2022-03-10 | February 2022 | 7.87 | 7.48 | +0.54 | +4.0 | +4.0 | +0.12% | ×0.64 | 57% |
| 2022-02-10 | January 2022 | 7.48 | 7.04 | +0.37 | +25.0 | +9.0 | -0.24% | ×1.43 | 90% |
| 2022-02-08 | January 2022 | 7.48 | 7.04 | +0.79 | +5.0 | +4.0 | +0.07% | ×0.64 | 57% |
| 2022-01-12 | December 2021 | 7.04 | 6.81 | +0.90 | +2.0 | -1.0 | -0.42% | ×0.16 | 18% |
| 2021-12-10 | November 2021 | 6.81 | 6.22 | +1.19 | -3.0 | -1.0 | -0.18% | ×0.3 | 18% |
| 2021-11-10 | October 2021 | 6.22 | 5.39 | +0.88 | +10.0 | +10.0 | +0.34% | ×2.98 | 93% |
PPI (336 releases since 2000 · PPI final demand, 12-month change (headline; series starts 2009))
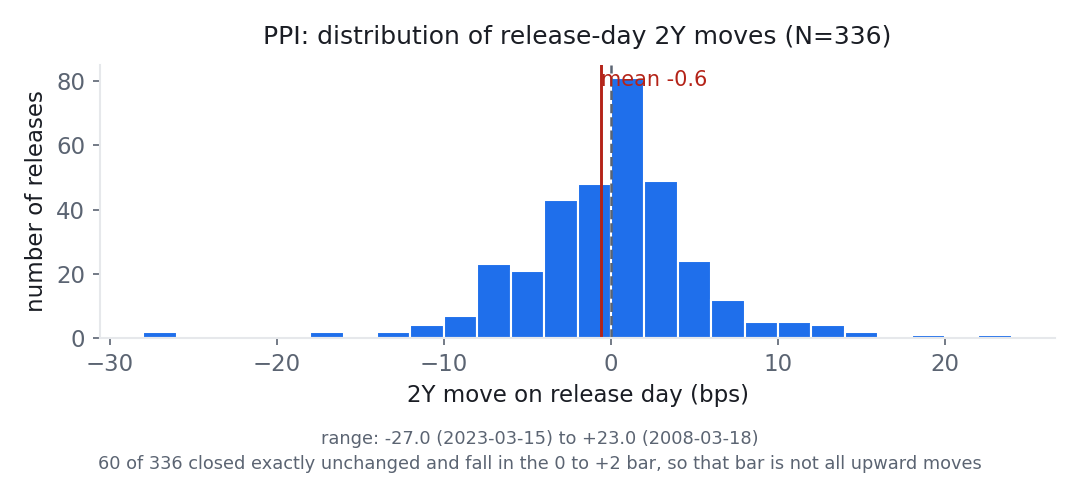
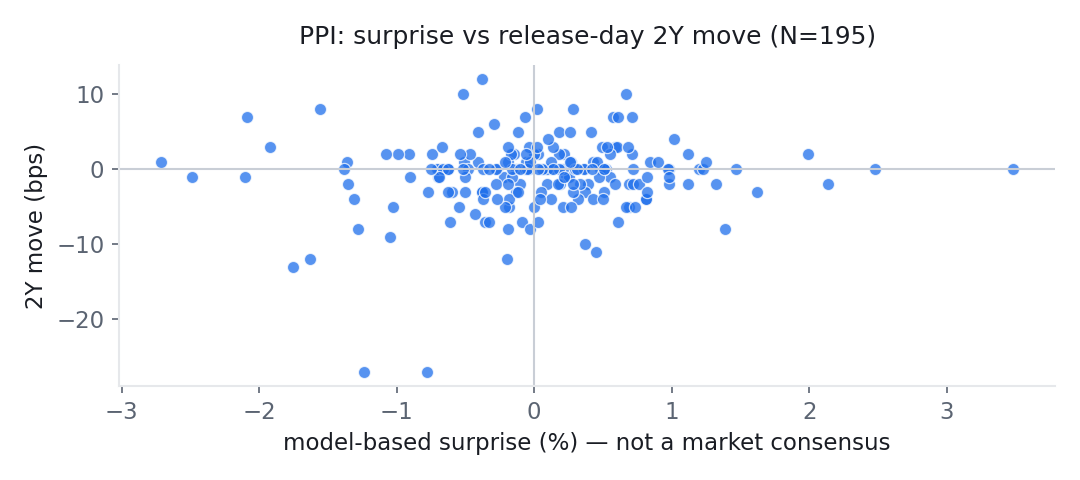
Showing the 60 most recent of 336 releases (2000-01-13 to 2026-08-13). Download all 336 as CSV.
| Release date | Data for | Actual (%) | Previous | Surprise | 2Y | 10Y | USD | 10Y vs normal | Larger than |
|---|---|---|---|---|---|---|---|---|---|
| 2026-08-13 | July 2026 | 4.66 | 5.54 | -1.03 | -5.0 | -5.0 | +0.06% | ×1.45 | 73% |
| 2026-07-15 | June 2026 | 5.54 | 5.83 | +0.27 | -5.0 | -3.0 | -0.14% | ×0.87 | 48% |
| 2026-06-11 | May 2026 | 5.83 | 5.70 | +1.39 | -8.0 | -10.0 | +0.17% | ×2.89 | 94% |
| 2026-05-13 | April 2026 | 5.70 | 4.28 | +2.14 | -2.0 | +0.0 | -0.04% | ×0.0 | 7% |
| 2026-04-14 | March 2026 | 4.28 | 3.35 | +1.12 | -2.0 | -4.0 | -0.53% | ×1.16 | 59% |
| 2026-03-18 | February 2026 | 3.35 | 3.04 | +0.28 | +8.0 | +6.0 | +0.08% | ×1.74 | 80% |
| 2026-02-27 | January 2026 | 3.04 | 3.09 | +0.04 | -4.0 | -5.0 | -0.07% | ×1.45 | 73% |
| 2026-01-30 | December 2025 | 3.09 | 3.15 | +0.22 | -1.0 | +2.0 | +0.39% | ×0.58 | 35% |
| 2026-01-14 | December 2025 | 3.09 | 3.15 | +0.17 | -2.0 | -3.0 | -0.16% | ×0.87 | 48% |
| 2025-11-25 | October 2025 | 2.83 | 3.05 | +0.05 | -3.0 | -3.0 | -0.23% | ×0.76 | 48% |
| 2025-09-10 | August 2025 | 2.69 | 3.23 | -0.10 | +0.0 | -4.0 | -0.03% | ×1.01 | 59% |
| 2025-08-14 | July 2025 | 3.23 | 2.43 | +0.71 | +7.0 | +5.0 | +0.43% | ×1.27 | 73% |
| 2025-07-16 | June 2025 | 2.43 | 2.72 | -0.33 | -7.0 | -4.0 | -0.08% | ×1.01 | 59% |
| 2025-06-12 | May 2025 | 2.72 | 2.40 | -0.27 | -4.0 | -5.0 | -0.34% | ×1.27 | 73% |
| 2025-05-15 | April 2025 | 2.40 | 3.16 | -1.05 | -9.0 | -8.0 | +0.12% | ×2.03 | 89% |
| 2025-04-11 | March 2025 | 3.16 | 3.40 | -0.38 | +12.0 | +8.0 | -0.86% | ×2.03 | 89% |
| 2025-03-13 | February 2025 | 3.40 | 3.79 | +0.03 | -7.0 | -5.0 | +0.11% | ×1.27 | 73% |
| 2025-02-13 | January 2025 | 3.79 | 3.44 | +0.73 | -5.0 | -10.0 | -0.34% | ×2.54 | 94% |
| 2025-01-14 | December 2024 | 3.44 | 2.89 | +0.82 | -3.0 | -1.0 | -0.51% | ×0.25 | 21% |
| 2024-12-12 | November 2024 | 2.89 | 2.84 | +0.53 | +3.0 | +6.0 | +0.08% | ×1.34 | 80% |
| 2024-11-14 | October 2024 | 2.84 | 2.14 | +0.61 | +7.0 | -1.0 | +0.03% | ×0.22 | 21% |
| 2024-10-11 | September 2024 | 2.14 | 2.11 | -0.36 | -3.0 | -1.0 | -0.09% | ×0.22 | 21% |
| 2024-09-12 | August 2024 | 2.11 | 2.43 | -0.54 | +2.0 | +3.0 | -0.27% | ×0.67 | 48% |
| 2024-08-13 | July 2024 | 2.43 | 2.96 | -0.19 | -8.0 | -5.0 | -0.17% | ×1.12 | 73% |
| 2024-07-12 | June 2024 | 2.96 | 2.57 | +0.67 | -5.0 | -2.0 | -0.27% | ×0.45 | 35% |
| 2024-06-13 | May 2024 | 2.57 | 2.32 | +0.61 | -7.0 | -7.0 | +0.16% | ×1.56 | 85% |
| 2024-05-14 | April 2024 | 2.32 | 1.98 | +0.81 | -4.0 | -3.0 | -0.08% | ×0.67 | 48% |
| 2024-04-11 | March 2024 | 1.98 | 1.57 | +0.81 | -4.0 | +1.0 | +0.03% | ×0.22 | 21% |
| 2024-03-14 | February 2024 | 1.57 | 0.97 | +0.57 | +7.0 | +10.0 | +0.23% | ×2.23 | 94% |
| 2024-02-16 | January 2024 | 0.97 | 1.05 | +0.02 | +8.0 | +6.0 | -0.05% | ×1.34 | 80% |
| 2024-02-14 | January 2024 | 0.97 | 1.05 | -0.03 | -8.0 | -4.0 | -0.10% | ×0.89 | 59% |
| 2024-01-12 | December 2023 | 1.05 | 0.83 | -0.20 | -12.0 | -2.0 | -0.30% | ×0.45 | 35% |
| 2023-12-13 | November 2023 | 0.83 | 1.11 | -0.78 | -27.0 | -16.0 | +0.39% | ×2.64 | 99% |
| 2023-11-15 | October 2023 | 1.11 | 1.81 | -0.52 | +10.0 | +9.0 | -0.23% | ×1.49 | 92% |
| 2023-10-11 | September 2023 | 1.81 | 1.90 | +0.68 | +3.0 | -8.0 | -0.13% | ×1.32 | 89% |
| 2023-09-14 | August 2023 | 1.90 | 1.18 | +1.02 | +4.0 | +4.0 | +0.15% | ×0.66 | 59% |
| 2023-08-11 | July 2023 | 1.18 | 0.30 | -0.07 | +7.0 | +7.0 | +0.39% | ×1.16 | 85% |
| 2023-07-13 | June 2023 | 0.30 | 1.15 | -1.75 | -13.0 | -10.0 | -0.39% | ×1.65 | 94% |
| 2023-06-14 | May 2023 | 1.15 | 2.29 | -2.09 | +7.0 | -1.0 | -0.35% | ×0.17 | 21% |
| 2023-05-11 | April 2023 | 2.29 | 2.70 | -2.10 | -1.0 | -4.0 | +0.37% | ×0.66 | 59% |
| 2023-04-13 | March 2023 | 2.70 | 4.72 | -2.71 | +1.0 | +4.0 | -0.51% | ×0.66 | 59% |
| 2023-03-15 | February 2023 | 4.72 | 5.75 | -1.24 | -27.0 | -13.0 | +0.90% | ×2.15 | 98% |
| 2023-02-16 | January 2023 | 5.75 | 6.38 | -0.75 | +0.0 | +5.0 | +0.01% | ×0.83 | 73% |
| 2023-02-14 | January 2023 | 5.75 | 6.38 | -1.56 | +8.0 | +5.0 | -0.05% | ×0.83 | 73% |
| 2023-01-18 | December 2022 | 6.38 | 7.37 | -1.63 | -12.0 | -16.0 | -0.11% | ×2.64 | 99% |
| 2022-12-09 | November 2022 | 7.37 | 8.18 | -1.08 | +2.0 | +9.0 | +0.00% | ×1.43 | 92% |
| 2022-11-15 | October 2022 | 8.18 | 8.49 | -0.77 | -3.0 | -8.0 | -0.31% | ×1.27 | 89% |
| 2022-10-12 | September 2022 | 8.49 | 8.67 | -1.35 | -2.0 | -2.0 | +0.38% | ×0.32 | 35% |
| 2022-09-14 | August 2022 | 8.67 | 9.69 | -1.92 | +3.0 | -1.0 | +0.02% | ×0.16 | 21% |
| 2022-08-11 | July 2022 | 9.69 | 11.15 | -1.38 | +0.0 | +9.0 | -0.03% | ×1.43 | 92% |
| 2022-07-14 | June 2022 | 11.15 | 10.94 | -0.06 | +2.0 | +5.0 | +0.63% | ×0.79 | 73% |
| 2022-06-14 | May 2022 | 10.94 | 11.11 | -0.12 | +5.0 | +6.0 | +0.42% | ×0.95 | 80% |
| 2022-05-12 | April 2022 | 11.11 | 11.59 | +0.37 | -10.0 | -7.0 | +0.74% | ×1.11 | 85% |
| 2022-04-13 | March 2022 | 11.59 | 10.47 | +1.32 | -2.0 | -2.0 | -0.09% | ×0.32 | 35% |
| 2022-03-15 | February 2022 | 10.47 | 10.17 | +0.28 | -2.0 | +1.0 | +0.08% | ×0.16 | 21% |
| 2022-02-15 | January 2022 | 10.17 | 10.22 | +0.03 | +0.0 | +7.0 | -0.23% | ×1.11 | 85% |
| 2022-02-11 | January 2022 | 10.17 | 10.22 | +0.45 | -11.0 | -11.0 | +0.25% | ×1.75 | 97% |
| 2022-01-13 | December 2021 | 10.22 | 10.02 | +0.98 | -1.0 | -4.0 | -0.16% | ×0.64 | 59% |
| 2021-12-14 | November 2021 | 10.02 | 8.92 | +1.25 | +1.0 | +2.0 | +0.34% | ×0.6 | 35% |
| 2021-11-09 | October 2021 | 8.92 | 8.78 | +0.50 | -4.0 | -5.0 | -0.06% | ×1.49 | 73% |
NFP (jobs) (326 releases since 2000 · Nonfarm payrolls, monthly change)
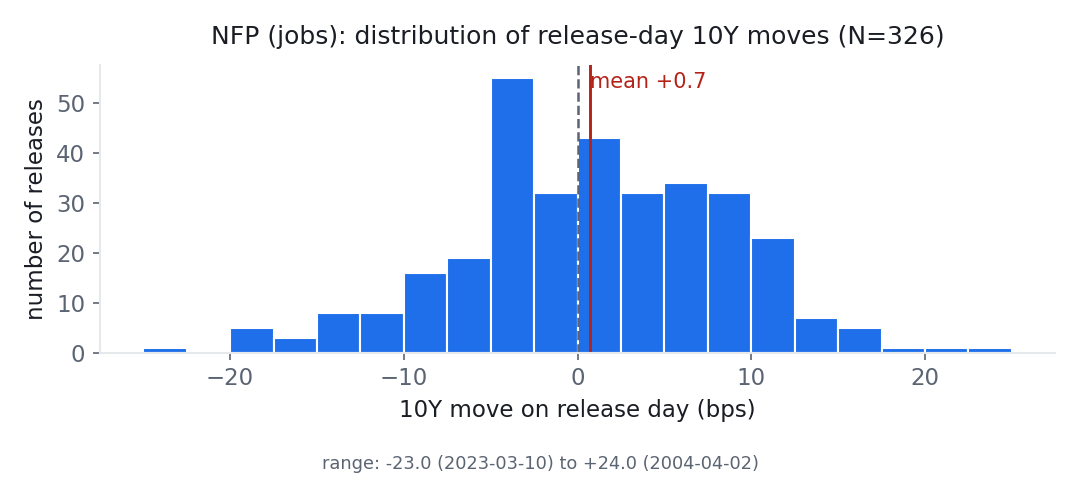
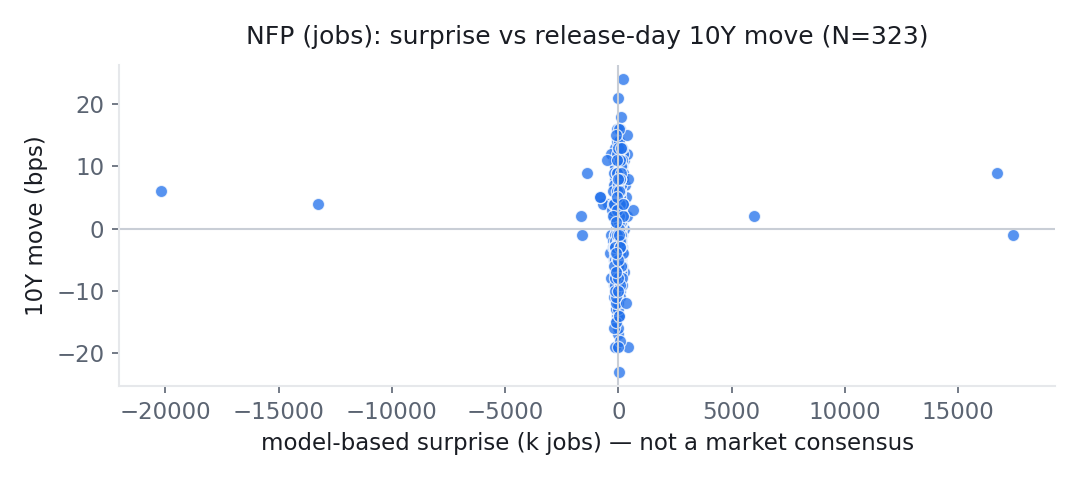
Showing the 60 most recent of 326 releases (2000-01-07 to 2026-08-07). Download all 326 as CSV.
| Release date | Data for | Actual (k jobs) | Previous | Surprise | 2Y | 10Y | USD | 10Y vs normal | Larger than |
|---|---|---|---|---|---|---|---|---|---|
| 2026-08-07 | July 2026 | -23.00 | 20.00 | -100.00 | -6.0 | -4.0 | -0.37% | ×1.16 | 44% |
| 2026-07-02 | June 2026 | 20.00 | 63.00 | -121.67 | -3.0 | +1.0 | -0.38% | ×0.29 | 13% |
| 2026-06-05 | May 2026 | 63.00 | 148.00 | -5.67 | +12.0 | +8.0 | +0.60% | ×2.32 | 72% |
| 2026-05-08 | April 2026 | 148.00 | 214.00 | +75.33 | -2.0 | -3.0 | +0.02% | ×0.87 | 34% |
| 2026-04-03 | March 2026 | 214.00 | -156.00 | +218.33 | +5.0 | +4.0 | +0.13% | ×1.16 | 44% |
| 2026-03-06 | February 2026 | -156.00 | 160.00 | -217.33 | -1.0 | +2.0 | -0.06% | ×0.58 | 23% |
| 2026-02-11 | January 2026 | 160.00 | -17.00 | +198.67 | +7.0 | +2.0 | -0.05% | ×0.58 | 23% |
| 2026-01-09 | December 2025 | -17.00 | 41.00 | +39.33 | +5.0 | -1.0 | +0.11% | ×0.29 | 13% |
| 2025-12-16 | November 2025 | 41.00 | -140.00 | +89.67 | -3.0 | -3.0 | -0.05% | ×0.76 | 34% |
| 2025-11-20 | October 2025 | -140.00 | 76.00 | -131.33 | -3.0 | -3.0 | +0.16% | ×0.76 | 34% |
| 2025-09-05 | August 2025 | -70.00 | 64.00 | -89.00 | -8.0 | -7.0 | -0.53% | ×1.77 | 66% |
| 2025-08-01 | July 2025 | 64.00 | -20.00 | +30.33 | -25.0 | -14.0 | -0.42% | ×3.55 | 94% |
| 2025-07-03 | June 2025 | -20.00 | 13.00 | -82.67 | +10.0 | +5.0 | -0.05% | ×1.27 | 53% |
| 2025-06-06 | May 2025 | 13.00 | 108.00 | -59.33 | +12.0 | +11.0 | +0.17% | ×2.79 | 87% |
| 2025-05-02 | April 2025 | 108.00 | 67.00 | +87.67 | +13.0 | +8.0 | -0.52% | ×2.03 | 72% |
| 2025-04-04 | March 2025 | 67.00 | 42.00 | -10.00 | -3.0 | -5.0 | +0.87% | ×1.27 | 53% |
| 2025-03-07 | February 2025 | 42.00 | -48.00 | -65.67 | +3.0 | +3.0 | -0.10% | ×0.76 | 34% |
| 2025-02-07 | January 2025 | -48.00 | 237.00 | -182.67 | +8.0 | +4.0 | +0.18% | ×1.01 | 44% |
| 2025-01-10 | December 2024 | 237.00 | 134.00 | +129.67 | +13.0 | +9.0 | +0.45% | ×2.28 | 79% |
| 2024-12-06 | November 2024 | 134.00 | 33.00 | +68.33 | -5.0 | -2.0 | +0.21% | ×0.45 | 23% |
| 2024-11-01 | October 2024 | 33.00 | 155.00 | -39.33 | +5.0 | +9.0 | +0.01% | ×2.01 | 79% |
| 2024-10-04 | September 2024 | 155.00 | 9.00 | +105.33 | +23.0 | +13.0 | +0.08% | ×2.9 | 92% |
| 2024-09-06 | August 2024 | 9.00 | 53.00 | -63.67 | -9.0 | -1.0 | +0.04% | ×0.22 | 13% |
| 2024-08-02 | July 2024 | 53.00 | 87.00 | -23.33 | -28.0 | -19.0 | -0.32% | ×4.24 | 99% |
| 2024-07-05 | June 2024 | 87.00 | 78.00 | -36.33 | -11.0 | -8.0 | -0.24% | ×1.79 | 72% |
| 2024-06-07 | May 2024 | 78.00 | 64.00 | -88.00 | +15.0 | +15.0 | +0.96% | ×3.35 | 95% |
| 2024-05-03 | April 2024 | 64.00 | 228.00 | -139.00 | -6.0 | -8.0 | -0.25% | ×1.79 | 72% |
| 2024-04-05 | March 2024 | 228.00 | 206.00 | +49.67 | +8.0 | +8.0 | +0.17% | ×1.79 | 72% |
| 2024-03-08 | February 2024 | 206.00 | 175.00 | +45.00 | -2.0 | +0.0 | -0.18% | ×0.0 | 3% |
| 2024-02-02 | January 2024 | 175.00 | 154.00 | +30.00 | +16.0 | +16.0 | +0.47% | ×3.57 | 97% |
| 2024-01-10 | December 2023 | 154.00 | 127.00 | +7.33 | +1.0 | +2.0 | +0.08% | ×0.45 | 23% |
| 2024-01-05 | December 2023 | 154.00 | 127.00 | +6.67 | +2.0 | +6.0 | -0.19% | ×1.34 | 61% |
| 2023-12-08 | November 2023 | 127.00 | 159.00 | -50.67 | +13.0 | +9.0 | +0.13% | ×1.49 | 79% |
| 2023-11-03 | October 2023 | 159.00 | 156.00 | -20.00 | -15.0 | -10.0 | -0.92% | ×1.65 | 83% |
| 2023-10-06 | September 2023 | 156.00 | 218.00 | -46.00 | +5.0 | +6.0 | -0.44% | ×0.99 | 61% |
| 2023-09-01 | August 2023 | 218.00 | 163.00 | -4.67 | +2.0 | +9.0 | +0.44% | ×1.49 | 79% |
| 2023-08-04 | July 2023 | 163.00 | 225.00 | -85.67 | -12.0 | -15.0 | -0.48% | ×2.48 | 95% |
| 2023-07-07 | June 2023 | 225.00 | 280.00 | +28.67 | -5.0 | +1.0 | -0.62% | ×0.17 | 13% |
| 2023-06-02 | May 2023 | 280.00 | 241.00 | +80.33 | +17.0 | +8.0 | -0.04% | ×1.32 | 72% |
| 2023-05-05 | April 2023 | 241.00 | 68.00 | -23.00 | +17.0 | +7.0 | -0.41% | ×1.16 | 66% |
| 2023-04-07 | March 2023 | 68.00 | 290.00 | -206.67 | +15.0 | +9.0 | +0.04% | ×1.49 | 79% |
| 2023-03-10 | February 2023 | 290.00 | 434.00 | +11.00 | -30.0 | -23.0 | -0.17% | ×3.8 | 100% |
| 2023-02-03 | January 2023 | 434.00 | 100.00 | +180.67 | +21.0 | +13.0 | +0.99% | ×2.15 | 92% |
| 2023-01-06 | December 2022 | 100.00 | 303.00 | -193.33 | -21.0 | -16.0 | -0.83% | ×2.64 | 97% |
| 2022-12-02 | November 2022 | 303.00 | 357.00 | +14.00 | +3.0 | -2.0 | +0.00% | ×0.32 | 23% |
| 2022-11-04 | October 2022 | 357.00 | 220.00 | -51.00 | -5.0 | +3.0 | -0.80% | ×0.48 | 34% |
| 2022-10-07 | September 2022 | 220.00 | 290.00 | -259.33 | +7.0 | +6.0 | +0.05% | ×0.95 | 61% |
| 2022-09-02 | August 2022 | 290.00 | 714.00 | -193.00 | -11.0 | -6.0 | -0.50% | ×0.95 | 61% |
| 2022-08-05 | July 2022 | 714.00 | 434.00 | +366.33 | +21.0 | +15.0 | +0.40% | ×2.38 | 95% |
| 2022-07-08 | June 2022 | 434.00 | 301.00 | +67.67 | +9.0 | +8.0 | -0.21% | ×1.27 | 72% |
| 2022-06-03 | May 2022 | 301.00 | 308.00 | -238.00 | +1.0 | +4.0 | +0.13% | ×0.64 | 44% |
| 2022-05-06 | April 2022 | 308.00 | 490.00 | -191.67 | +1.0 | +7.0 | -0.12% | ×1.11 | 66% |
| 2022-04-01 | March 2022 | 490.00 | 819.00 | -41.67 | +16.0 | +7.0 | +0.23% | ×1.11 | 66% |
| 2022-03-04 | February 2022 | 819.00 | 190.00 | +341.00 | -3.0 | -12.0 | +0.60% | ×1.91 | 90% |
| 2022-02-04 | January 2022 | 190.00 | 586.00 | -491.67 | +12.0 | +11.0 | +0.20% | ×1.75 | 87% |
| 2022-01-07 | December 2021 | 586.00 | 658.00 | -52.67 | -1.0 | +3.0 | -0.31% | ×0.48 | 34% |
| 2021-12-03 | November 2021 | 658.00 | 801.00 | +54.67 | -3.0 | -9.0 | +0.19% | ×2.69 | 79% |
| 2021-11-05 | October 2021 | 801.00 | 457.00 | +150.67 | -2.0 | -8.0 | -0.25% | ×2.39 | 72% |
| 2021-10-08 | September 2021 | 457.00 | 552.00 | -292.67 | +0.0 | +3.0 | +0.08% | ×0.9 | 34% |
| 2021-09-03 | August 2021 | 552.00 | 942.00 | -173.00 | +1.0 | +4.0 | -0.21% | ×1.19 | 44% |
PCE (331 releases since 2000 · PCE price index, 12-month change)
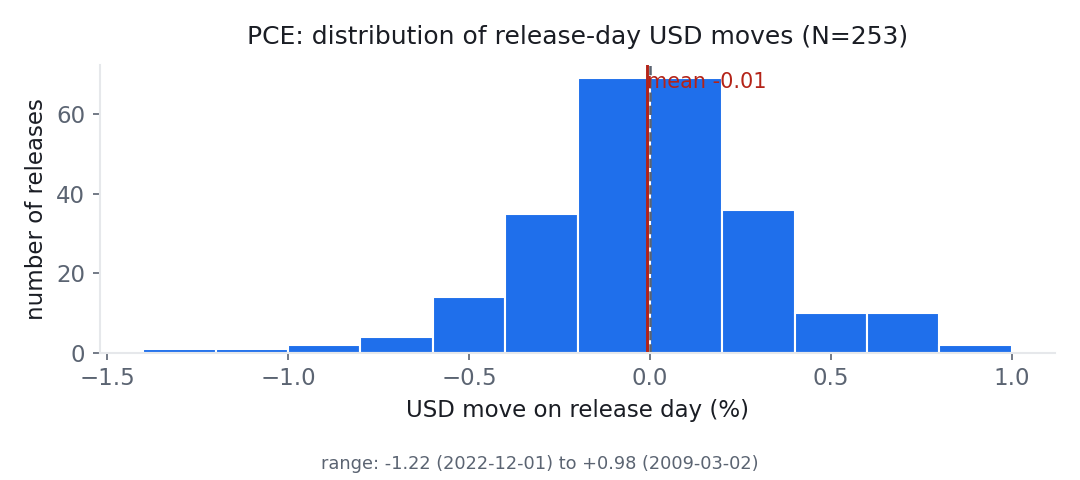
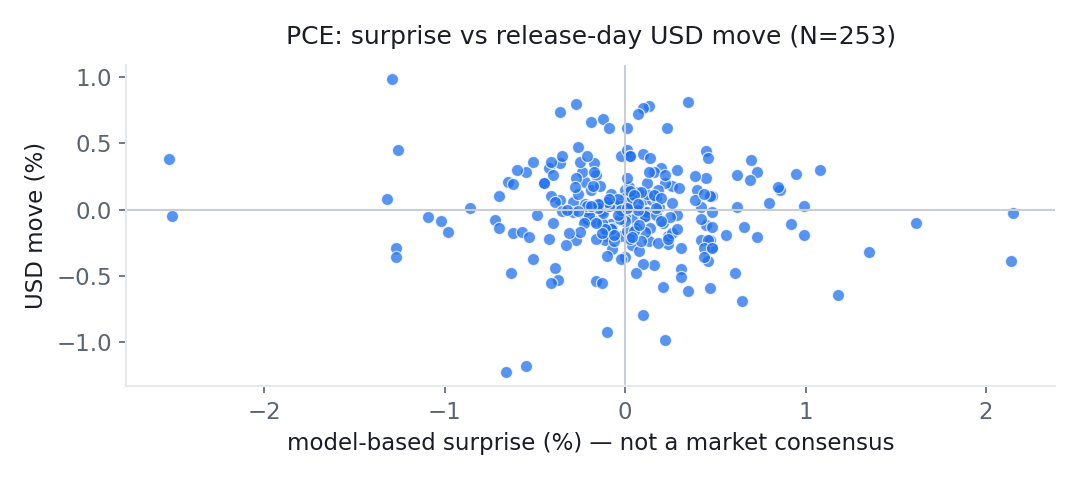
Showing the 60 most recent of 331 releases (2000-01-31 to 2026-08-26). Download all 331 as CSV.
| Release date | Data for | Actual (%) | Previous | Surprise | 2Y | 10Y | USD | 10Y vs normal | Larger than |
|---|---|---|---|---|---|---|---|---|---|
| 2026-08-26 | July 2026 | 3.70 | 3.72 | -0.18 | +2.0 | +2.0 | +0.18% | ×0.58 | 38% |
| 2026-07-30 | June 2026 | 3.72 | 4.11 | -0.10 | +1.0 | +1.0 | -0.92% | ×0.29 | 26% |
| 2026-06-25 | May 2026 | 4.11 | 3.80 | +0.48 | -2.0 | -1.0 | -0.29% | ×0.29 | 26% |
| 2026-05-28 | April 2026 | 3.80 | 3.54 | +0.48 | -1.0 | -3.0 | -0.13% | ×0.87 | 53% |
| 2026-04-30 | March 2026 | 3.54 | 2.87 | +0.44 | -4.0 | -2.0 | -0.36% | ×0.58 | 38% |
| 2026-04-09 | March 2026 | 3.54 | 2.87 | +0.66 | -1.0 | +0.0 | -0.13% | ×0.0 | 10% |
| 2026-03-13 | February 2026 | 2.87 | 2.88 | +0.01 | -3.0 | +1.0 | +0.61% | ×0.29 | 26% |
| 2026-02-20 | January 2026 | 2.88 | 2.88 | +0.04 | +1.0 | +0.0 | -0.21% | ×0.0 | 10% |
| 2026-01-22 | December 2025 | 2.88 | 2.82 | +0.08 | +1.0 | +0.0 | -0.12% | ×0.0 | 10% |
| 2025-12-23 | November 2025 | 2.82 | 2.71 | +0.09 | +4.0 | +1.0 | -0.24% | ×0.25 | 26% |
| 2025-12-05 | November 2025 | 2.82 | 2.71 | +0.17 | +4.0 | +3.0 | +0.01% | ×0.76 | 53% |
| 2025-09-26 | August 2025 | 2.75 | 2.61 | +0.20 | -1.0 | +2.0 | -0.09% | ×0.51 | 38% |
| 2025-08-29 | July 2025 | 2.61 | 2.59 | +0.17 | -3.0 | +1.0 | -0.04% | ×0.25 | 26% |
| 2025-07-31 | June 2025 | 2.59 | 2.46 | +0.22 | +0.0 | -1.0 | +0.26% | ×0.25 | 26% |
| 2025-06-27 | May 2025 | 2.46 | 2.28 | +0.01 | +3.0 | +3.0 | +0.01% | ×0.76 | 53% |
| 2025-05-30 | April 2025 | 2.28 | 2.36 | -0.28 | -3.0 | -2.0 | +0.17% | ×0.51 | 38% |
| 2025-04-30 | March 2025 | 2.36 | 2.71 | -0.32 | -5.0 | -2.0 | -0.00% | ×0.51 | 38% |
| 2025-03-28 | February 2025 | 2.71 | 2.61 | +0.07 | -8.0 | -11.0 | +0.04% | ×2.79 | 95% |
| 2025-02-28 | January 2025 | 2.61 | 2.73 | +0.01 | -8.0 | -5.0 | +0.24% | ×1.27 | 74% |
| 2025-01-31 | December 2024 | 2.73 | 2.59 | +0.29 | +4.0 | +6.0 | +0.30% | ×1.52 | 80% |
| 2024-12-20 | November 2024 | 2.59 | 2.48 | +0.21 | -2.0 | -5.0 | -0.58% | ×1.12 | 74% |
| 2024-11-27 | October 2024 | 2.48 | 2.26 | +0.06 | -2.0 | -5.0 | -0.48% | ×1.12 | 74% |
| 2024-10-31 | September 2024 | 2.26 | 2.41 | -0.26 | +1.0 | -1.0 | -0.01% | ×0.22 | 26% |
| 2024-09-27 | August 2024 | 2.41 | 2.59 | -0.19 | -5.0 | -4.0 | +0.03% | ×0.89 | 65% |
| 2024-08-30 | July 2024 | 2.59 | 2.55 | -0.09 | +4.0 | +4.0 | +0.08% | ×0.89 | 65% |
| 2024-07-26 | June 2024 | 2.55 | 2.66 | -0.26 | -5.0 | -7.0 | +0.12% | ×1.56 | 85% |
| 2024-06-28 | May 2024 | 2.66 | 2.83 | -0.16 | +1.0 | +7.0 | -0.10% | ×1.56 | 85% |
| 2024-05-31 | April 2024 | 2.83 | 2.93 | +0.05 | -3.0 | -4.0 | +0.11% | ×0.89 | 65% |
| 2024-04-26 | March 2024 | 2.93 | 2.71 | +0.20 | +0.0 | -3.0 | +0.09% | ×0.67 | 53% |
| 2024-03-29 | February 2024 | 2.71 | 2.70 | -0.04 | +13.0 | +13.0 | -0.04% | ×2.9 | 97% |
| 2024-02-29 | January 2024 | 2.70 | 2.77 | -0.15 | +0.0 | -2.0 | +0.04% | ×0.45 | 38% |
| 2024-01-26 | December 2023 | 2.77 | 2.77 | -0.31 | +6.0 | +1.0 | -0.18% | ×0.22 | 26% |
| 2023-12-22 | November 2023 | 2.77 | 3.02 | -0.53 | -2.0 | +1.0 | -0.21% | ×0.17 | 26% |
| 2023-11-30 | October 2023 | 3.02 | 3.45 | -0.41 | +9.0 | +10.0 | +0.36% | ×1.65 | 92% |
| 2023-10-27 | September 2023 | 3.45 | 3.43 | +0.08 | -3.0 | -2.0 | -0.31% | ×0.33 | 38% |
| 2023-09-29 | August 2023 | 3.43 | 3.41 | -0.13 | -1.0 | +0.0 | -0.18% | ×0.0 | 10% |
| 2023-08-31 | July 2023 | 3.41 | 3.28 | -0.51 | -5.0 | -3.0 | +0.36% | ×0.5 | 53% |
| 2023-07-28 | June 2023 | 3.28 | 4.00 | -1.02 | -4.0 | -5.0 | -0.09% | ×0.83 | 74% |
| 2023-06-30 | May 2023 | 4.00 | 4.48 | -0.70 | +0.0 | -4.0 | -0.14% | ×0.66 | 65% |
| 2023-05-26 | April 2023 | 4.48 | 4.43 | -0.57 | +4.0 | -3.0 | -0.17% | ×0.5 | 53% |
| 2023-04-28 | March 2023 | 4.43 | 5.20 | -0.98 | -3.0 | -9.0 | -0.17% | ×1.49 | 90% |
| 2023-03-31 | February 2023 | 5.20 | 5.51 | -0.49 | -4.0 | -7.0 | -0.04% | ×1.16 | 85% |
| 2023-02-24 | January 2023 | 5.51 | 5.52 | -0.35 | +12.0 | +7.0 | +0.40% | ×1.16 | 85% |
| 2023-01-27 | December 2022 | 5.52 | 6.03 | -0.72 | +2.0 | +3.0 | -0.08% | ×0.5 | 53% |
| 2022-12-23 | November 2022 | 6.03 | 6.46 | -0.42 | +7.0 | +8.0 | -0.22% | ×1.27 | 87% |
| 2022-12-01 | November 2022 | 6.03 | 6.46 | -0.66 | -13.0 | -15.0 | -1.22% | ×2.38 | 98% |
| 2022-10-28 | September 2022 | 6.67 | 6.64 | -0.21 | +11.0 | +6.0 | +0.40% | ×0.95 | 80% |
| 2022-09-30 | August 2022 | 6.64 | 6.75 | -0.29 | +6.0 | +7.0 | -0.02% | ×1.11 | 85% |
| 2022-08-26 | July 2022 | 6.75 | 7.24 | -0.15 | +2.0 | +1.0 | +0.01% | ×0.16 | 26% |
| 2022-07-29 | June 2022 | 7.24 | 6.79 | +0.44 | +4.0 | -1.0 | -0.29% | ×0.16 | 26% |
| 2022-06-30 | May 2022 | 6.79 | 6.68 | +0.07 | -14.0 | -12.0 | +0.00% | ×1.91 | 96% |
| 2022-05-27 | April 2022 | 6.68 | 6.93 | +0.10 | +1.0 | -1.0 | -0.41% | ×0.16 | 26% |
| 2022-04-29 | March 2022 | 6.93 | 6.55 | +0.61 | +7.0 | +4.0 | -0.48% | ×0.64 | 65% |
| 2022-03-31 | February 2022 | 6.55 | 6.27 | +0.44 | -3.0 | -3.0 | +0.12% | ×0.48 | 53% |
| 2022-02-25 | January 2022 | 6.27 | 6.14 | +0.47 | +1.0 | +1.0 | -0.59% | ×0.16 | 26% |
| 2022-01-28 | December 2021 | 6.14 | 5.93 | +0.80 | -3.0 | -3.0 | +0.05% | ×0.48 | 53% |
| 2021-12-23 | November 2021 | 5.93 | 5.34 | +0.99 | +3.0 | +4.0 | -0.19% | ×1.19 | 65% |
| 2021-11-24 | October 2021 | 5.34 | 4.74 | +0.69 | +4.0 | -3.0 | +0.22% | ×0.9 | 53% |
| 2021-10-29 | September 2021 | 4.74 | 4.58 | +0.23 | -2.0 | -2.0 | +0.61% | ×0.6 | 38% |
| 2021-10-01 | September 2021 | 4.74 | 4.58 | +0.46 | -1.0 | -4.0 | -0.23% | ×1.19 | 65% |
Retail sales (342 releases since 2000 · Retail sales, monthly change)
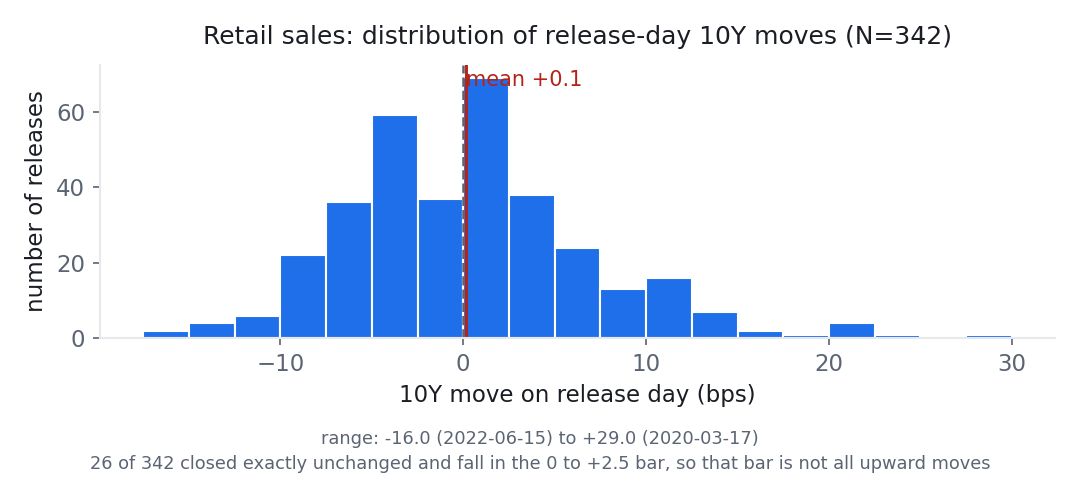
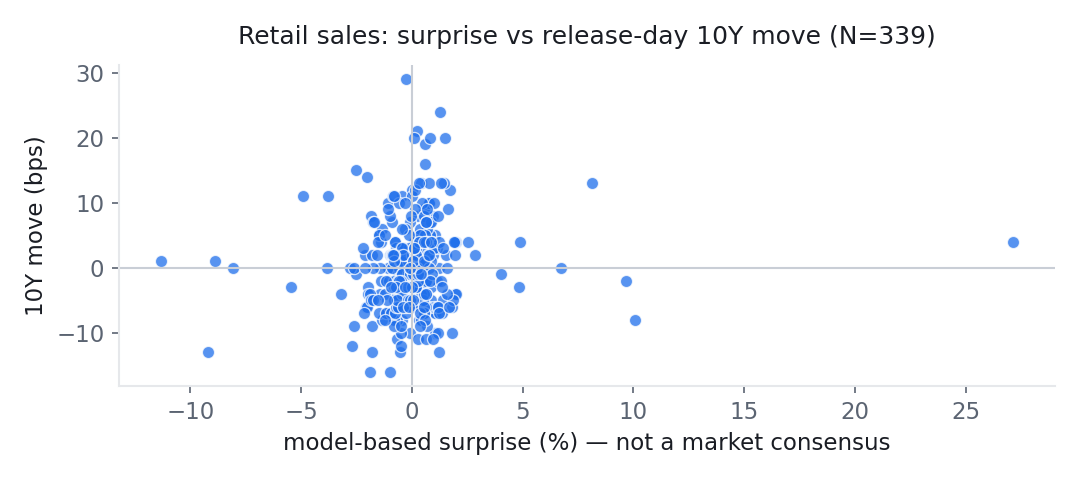
Showing the 60 most recent of 342 releases (2000-01-13 to 2026-08-14). Download all 342 as CSV.
| Release date | Data for | Actual (%) | Previous | Surprise | 2Y | 10Y | USD | 10Y vs normal | Larger than |
|---|---|---|---|---|---|---|---|---|---|
| 2026-08-14 | July 2026 | -0.58 | 0.25 | -1.20 | +2.0 | +5.0 | -0.24% | ×1.45 | 62% |
| 2026-07-16 | June 2026 | 0.25 | 0.93 | -0.86 | +3.0 | +2.0 | +0.02% | ×0.58 | 31% |
| 2026-06-17 | May 2026 | 0.93 | 0.67 | -0.44 | +15.0 | +6.0 | +0.11% | ×1.74 | 70% |
| 2026-05-14 | April 2026 | 0.67 | 1.72 | -0.78 | +2.0 | +1.0 | +0.17% | ×0.29 | 18% |
| 2026-04-21 | March 2026 | 1.72 | 0.92 | +0.85 | +6.0 | +4.0 | +0.17% | ×1.16 | 54% |
| 2026-04-01 | March 2026 | 1.72 | 0.92 | +1.42 | +2.0 | +3.0 | -0.76% | ×0.87 | 43% |
| 2026-03-06 | February 2026 | 0.92 | -0.03 | +0.76 | -1.0 | +2.0 | -0.06% | ×0.58 | 31% |
| 2026-02-10 | January 2026 | -0.03 | -0.00 | -0.14 | -3.0 | -6.0 | -0.10% | ×1.74 | 70% |
| 2026-01-14 | December 2025 | -0.00 | 0.50 | -0.32 | -2.0 | -3.0 | -0.16% | ×0.87 | 43% |
| 2025-12-16 | November 2025 | 0.50 | -0.16 | -0.01 | -3.0 | -3.0 | -0.05% | ×0.76 | 43% |
| 2025-11-25 | October 2025 | -0.16 | 0.07 | -0.96 | -3.0 | -3.0 | -0.23% | ×0.76 | 43% |
| 2025-09-16 | August 2025 | 0.62 | 1.07 | +0.40 | -3.0 | -1.0 | -0.36% | ×0.25 | 18% |
| 2025-08-15 | July 2025 | 1.07 | 0.70 | +1.24 | +1.0 | +4.0 | -0.25% | ×1.01 | 54% |
| 2025-07-17 | June 2025 | 0.70 | -1.10 | +0.56 | +3.0 | +1.0 | +0.18% | ×0.25 | 18% |
| 2025-06-17 | May 2025 | -1.10 | -0.12 | -2.16 | -3.0 | -7.0 | +0.29% | ×1.77 | 77% |
| 2025-05-15 | April 2025 | -0.12 | 1.65 | -1.23 | -9.0 | -8.0 | +0.12% | ×2.03 | 82% |
| 2025-04-25 | March 2025 | 1.65 | 0.04 | +1.37 | -3.0 | -3.0 | -0.03% | ×0.76 | 43% |
| 2025-04-16 | March 2025 | 1.65 | 0.04 | +1.66 | -7.0 | -6.0 | -0.41% | ×1.52 | 70% |
| 2025-03-17 | February 2025 | 0.04 | -0.84 | -0.10 | +4.0 | +0.0 | -0.26% | ×0.0 | 8% |
| 2025-02-14 | January 2025 | -0.84 | 0.76 | -1.51 | -5.0 | -5.0 | -0.58% | ×1.27 | 62% |
| 2025-01-16 | December 2024 | 0.76 | 0.50 | +0.06 | -4.0 | -5.0 | +0.18% | ×1.27 | 62% |
| 2024-12-17 | November 2024 | 0.50 | 0.74 | +0.05 | +0.0 | +1.0 | +0.19% | ×0.22 | 18% |
| 2024-11-15 | October 2024 | 0.74 | 0.86 | +0.23 | -3.0 | +0.0 | -0.09% | ×0.0 | 8% |
| 2024-10-17 | September 2024 | 0.86 | -0.26 | +0.66 | +3.0 | +7.0 | +0.15% | ×1.56 | 77% |
| 2024-09-17 | August 2024 | -0.26 | 0.92 | -0.80 | +3.0 | +2.0 | +0.09% | ×0.45 | 31% |
| 2024-08-15 | July 2024 | 0.92 | -0.05 | +0.69 | +14.0 | +9.0 | +0.13% | ×2.01 | 86% |
| 2024-07-16 | June 2024 | -0.05 | 0.75 | -0.41 | -1.0 | -6.0 | +0.07% | ×1.34 | 70% |
| 2024-06-18 | May 2024 | 0.75 | -0.01 | +0.53 | -6.0 | -6.0 | -0.21% | ×1.34 | 70% |
| 2024-05-15 | April 2024 | -0.01 | 0.34 | -0.47 | -8.0 | -9.0 | -0.47% | ×2.01 | 86% |
| 2024-04-23 | March 2024 | 0.34 | 0.71 | +0.27 | -11.0 | -1.0 | -0.27% | ×0.22 | 18% |
| 2024-04-15 | March 2024 | 0.34 | 0.71 | +0.34 | +5.0 | +13.0 | +0.11% | ×2.9 | 96% |
| 2024-03-14 | February 2024 | 0.71 | -0.85 | +0.99 | +7.0 | +10.0 | +0.23% | ×2.23 | 89% |
| 2024-02-15 | January 2024 | -0.85 | 0.14 | -0.70 | +0.0 | -3.0 | -0.15% | ×0.67 | 43% |
| 2024-01-17 | December 2023 | 0.14 | -0.12 | +0.11 | +12.0 | +3.0 | +0.39% | ×0.67 | 43% |
| 2023-12-14 | November 2023 | -0.12 | -0.47 | -0.50 | -9.0 | -12.0 | -1.31% | ×1.98 | 94% |
| 2023-11-15 | October 2023 | -0.47 | 0.68 | -1.07 | +10.0 | +9.0 | -0.23% | ×1.49 | 86% |
| 2023-10-17 | September 2023 | 0.68 | 0.93 | +0.15 | +10.0 | +12.0 | -0.16% | ×1.98 | 94% |
| 2023-09-14 | August 2023 | 0.93 | 0.19 | +0.54 | +4.0 | +4.0 | +0.15% | ×0.66 | 54% |
| 2023-08-15 | July 2023 | 0.19 | 0.48 | -0.41 | -4.0 | +2.0 | +0.12% | ×0.33 | 31% |
| 2023-07-18 | June 2023 | 0.48 | 0.51 | +0.39 | +0.0 | -1.0 | -0.09% | ×0.17 | 18% |
| 2023-06-15 | May 2023 | 0.51 | 0.82 | +0.94 | -12.0 | -11.0 | -0.19% | ×1.82 | 92% |
| 2023-05-16 | April 2023 | 0.82 | -1.05 | +1.92 | +7.0 | +4.0 | +0.01% | ×0.66 | 54% |
| 2023-04-24 | March 2023 | -1.05 | -1.19 | -1.76 | -5.0 | -5.0 | -0.09% | ×0.83 | 62% |
| 2023-04-14 | March 2023 | -1.05 | -1.19 | -1.72 | +12.0 | +7.0 | +0.39% | ×1.16 | 77% |
| 2023-03-15 | February 2023 | -1.19 | 4.37 | -1.80 | -27.0 | -13.0 | +0.90% | ×2.15 | 96% |
| 2023-02-15 | January 2023 | 4.37 | -1.17 | +4.88 | +2.0 | +4.0 | +0.44% | ×0.66 | 54% |
| 2023-01-18 | December 2022 | -1.17 | -1.38 | -0.97 | -12.0 | -16.0 | -0.11% | ×2.64 | 98% |
| 2022-12-15 | November 2022 | -1.38 | 1.03 | -1.84 | +0.0 | -5.0 | +0.60% | ×0.79 | 62% |
| 2022-11-16 | October 2022 | 1.03 | -0.26 | +1.24 | -2.0 | -13.0 | +0.20% | ×2.06 | 96% |
| 2022-10-14 | September 2022 | -0.26 | 0.61 | -0.45 | +1.0 | +3.0 | +0.47% | ×0.48 | 43% |
| 2022-09-15 | August 2022 | 0.61 | -0.99 | +0.64 | +9.0 | +4.0 | +0.35% | ×0.64 | 54% |
| 2022-08-17 | July 2022 | -0.99 | 0.95 | -1.76 | +3.0 | +7.0 | +0.32% | ×1.11 | 77% |
| 2022-07-15 | June 2022 | 0.95 | -0.05 | -0.18 | -2.0 | -3.0 | -0.47% | ×0.48 | 43% |
| 2022-06-15 | May 2022 | -0.05 | 1.41 | -1.87 | -25.0 | -16.0 | -0.02% | ×2.54 | 98% |
| 2022-05-17 | April 2022 | 1.41 | 2.03 | -0.29 | +13.0 | +10.0 | -0.66% | ×1.59 | 89% |
| 2022-04-25 | March 2022 | 2.03 | 1.04 | +0.38 | -9.0 | -9.0 | +0.52% | ×1.43 | 86% |
| 2022-04-14 | March 2022 | 2.03 | 1.04 | +1.32 | +10.0 | +13.0 | +0.41% | ×2.06 | 96% |
| 2022-03-16 | February 2022 | 1.04 | 1.87 | +0.34 | +10.0 | +4.0 | -0.37% | ×0.64 | 54% |
| 2022-02-16 | January 2022 | 1.87 | -0.79 | +1.31 | -6.0 | -2.0 | -0.21% | ×0.32 | 31% |
| 2022-01-14 | December 2021 | -0.79 | 1.02 | -1.84 | +8.0 | +8.0 | +0.18% | ×1.27 | 82% |
How to read it
- Actual / Previous units differ by release: CPI, PPI and PCE are 12-month percentage changes; retail sales is a monthly percentage change; the jobs report is the monthly change in payrolls, in thousands.
- 2Y / 10Y are changes in the Treasury yield in basis points, measured from the prior day's close to the release day's close. USD is the percentage change in the Federal Reserve's broad dollar index.
- 10Y vs normal divides the absolute 10-year move by the average absolute move on an ordinary trading day, so ×2.0 means "twice a normal day."
- A dash means the figure was not available for that date.
What this database is for
Scanning it answers questions a calendar cannot:
- How unusual was this month's reaction compared to the last three years?
- When CPI came in well above trend, what actually happened to the 10-year? (Answer: no consistent direction — see the full analysis.)
- Which release produces the biggest moves? (The jobs report — see why.)
It also grows. Every month the pipeline appends the new release, so the database gets more useful over time rather than going stale.
Method and sources
Release-day reactions are measured from the prior close to the release-day close, so nothing uses information that was unavailable before the release. Full methodology: how we test and what is an event study?
- Economic readings: U.S. Bureau of Labor Statistics (CPI, PPI, payrolls), Bureau of Economic Analysis (PCE), Census Bureau (retail sales) — via FRED.
- Markets: Treasury constant-maturity yields and the broad dollar index, Federal Reserve Board; crude oil, U.S. Energy Information Administration — via FRED.
- All series are U.S. government public domain (17 U.S.C. §105).
Historical statistics for informational purposes only, not financial advice. Results may vary with sample, period, and baseline definition.