Does CPI move the 10-year Treasury yield?
Most similar past releases: March 2006, August 2024, March 2025
Reported figure: U.S. government release. Market move: change from the prior close, Federal Reserve Board data via FRED. "Normal day" is that calendar year's average daily move. Browse every release.
Every month, the U.S. Consumer Price Index (CPI) lands at 8:30 a.m. Eastern and the financial press treats it as one of the most important numbers of the cycle. The story is always the same shape: a "hot" inflation print is supposed to push Treasury yields up as traders brace for tighter policy, and a "cool" print is supposed to pull them down. It sounds obvious. The question this page answers is narrower and more honest: when CPI actually prints, does the 10-year Treasury yield move in a way you could have predicted — and does it move more than it would on an ordinary day?
To find out, we measured the 10-year yield's reaction on 37 consecutive CPI release days from 2023 to 2025 and compared it against a baseline of ordinary trading days, with a significance test on every claim. The two questions — which way the yield moves, and how much it moves — turn out to have very different answers.
Verdict
- Direction (release day): Not Significant
- Volatility (release day): Significant
- Volatility (5 days): Not Significant
On CPI release day, the direction of the 10-year Treasury yield is unpredictable (p=0.76) — but the size of the move is about 1.58× a normal day (p=0.004).
Bottom line: CPI days are genuinely more volatile for Treasury yields — but the direction of the move is not something the release lets you predict in advance.
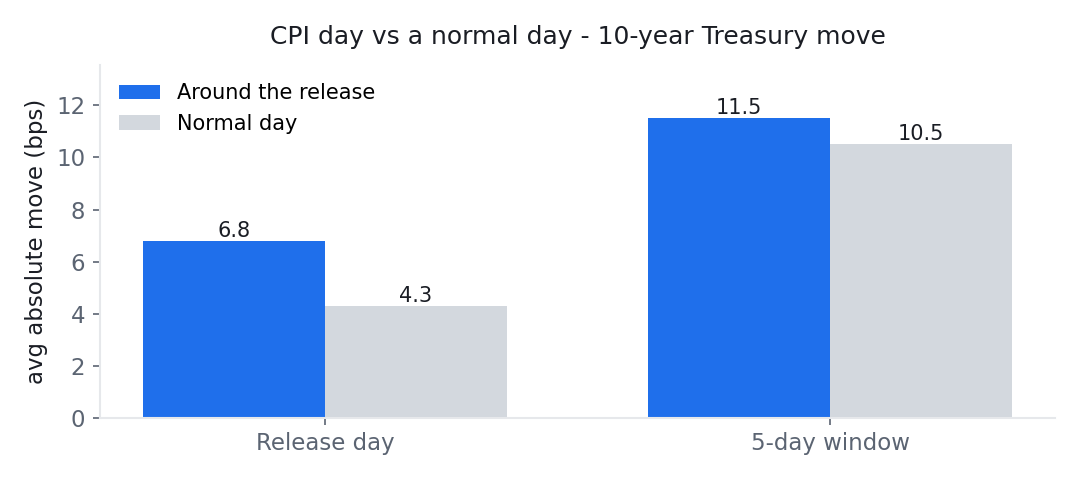
Average absolute 10-year yield move around CPI releases versus normal days (N=37). Chart: Macro or Noise, from Federal Reserve Board data via FRED (public domain).
What the numbers say
Across the 37 CPI releases, the average signed move in the 10-year yield on release day was essentially zero — about 0.4 basis points, with a p-value of 0.76. In plain terms, a coin flip describes the direction about as well as anything: on any given CPI day the yield was roughly as likely to fall as to rise, and the average of all those moves cancelled out to nothing.
The size of the move is a completely different story. On a normal day, the 10-year yield moves about 4.3 basis points in absolute terms. On CPI release days, it moved about 6.8 basis points — roughly 1.58 times a normal day — and that gap clears the significance bar on its own (p=0.004). So the market clearly reacts to CPI; it just doesn't react in a consistent direction.
By five trading days later, even that volatility edge has faded. The five-day move on CPI weeks (11.5 bps) is barely larger than an ordinary five-day stretch (10.5 bps), and the difference is no longer significant. Whatever CPI does to the bond market, it does it on the day and it is mostly gone within a week.
Why the direction is unpredictable
This surprises people, so it is worth spelling out. There are two reasons a big, closely-watched release can move the market a lot without being directionally predictable:
- Hot and cool prints offset. Over any real sample you get some upside inflation surprises and some downside ones. Each pushes yields a different way, and averaged together the signed moves cancel — which is exactly what a mean of ~0 with a high p-value looks like.
- The expected part is already in the price. By the morning CPI drops, the bond market has spent weeks pricing in a forecast. What actually moves yields is the surprise versus that forecast — not the headline number itself. Since the surprise is, by definition, not knowable ahead of time, the release-day direction is not something you can position for using the release alone.
That second point is the crux of this whole site: markets react to what they did not already expect. Measuring the reaction to the release (which is what we do here, using only public data) tells you about volatility, not about a tradable direction.
What this means in practice
The practical read is modest and, we think, useful precisely because it is modest:
- Expect a bigger-than-usual move, in an unknown direction. If you hold Treasuries or anything sensitive to yields, CPI day is a day to expect more movement than normal — but not a day the release itself tells you which way.
- "CPI came in hot, so yields will rise" is not supported here. The average CPI-day direction is indistinguishable from zero. Commentary that confidently predicts the direction from the headline is describing a pattern our data does not find.
- The effect is a release-day event. If you are looking a week out, the CPI-day volatility bump has largely washed out.
None of this is advice — it is a description of what 37 releases actually did, and results can change with a different sample, period, or definition.
Key findings, generated from the data
- Across 338 releases, the 10Y moved an average of 4.82 bps on release day (absolute).
- The largest single reaction was -51.0 bps on 2009-03-18 (February 2009 data).
- Splitting by our trend-based surprise shows no reliable directional pattern: pooled p=0.31, and by era — 2000-2012: -1.87 (p=0.10); 2013-2019: -1.76 (p=0.06); 2020-2026: +2.38 (p=0.15). Note the sign is not even stable across periods.
- Because our surprise is a trend proxy rather than a market consensus, and because these splits are sensitive to the period chosen, treat all of the above as patterns observed in this sample rather than as established effects.
- Bigger surprises do produce bigger moves: the largest third of surprises averaged 5.83 versus 4.23 for the smallest third (p=0.015).
Generated automatically from our event database by a rule-based script (no language model). "Surprise" is model-based — the reading minus the average of the previous three — and is not a market consensus forecast. See every release in the database.
The data
| Dimension | Horizon | Value | Baseline | Test stat | p-value | Verdict |
|---|---|---|---|---|---|---|
| Direction | release day | 0.4 bps | 0.0 bps | 0.31 | 0.755 | Not Significant |
| Volatility | release day | 6.8 bps | 4.3 bps | 1.58 | 0.004 | Significant on its own |
| Volatility | 5 days | 11.5 bps | 10.5 bps | 1.10 | 0.261 | Not Significant |
Methodology
- Events (N): 37 CPI releases.
- Window: 2023-01-12 → 2025-12-18.
- Measurement: the change in the 10-year yield from the prior close to the close at the end of the holding window, so nothing uses information unavailable before the release (look-ahead protected).
- Baseline: the unconditional distribution of same-length moves across all trading days — what a "normal" stretch looks like.
- Tests: a one-sample t-test of the signed move against zero (direction), and a bootstrap of the absolute move against the baseline (size).
Caveats
- This result is significant on its own but does not survive correction across our whole grid. Tested by itself, the release-day gap clears the bar (p=0.004). Once we correct for testing eight releases against nine markets at once, CPI drops out and only the jobs report remains — see the full grid. We report both, because the gap between "significant alone" and "robust across the grid" is where most false findings live.
- The effect is concentrated on the release day and fades within five trading days.
- The event study above does not condition on surprise: it measures the reaction to the release itself. The "Key findings" block does add a split by our own trend-based proxy, which is not a market consensus forecast — consensus data is proprietary and outside our public-domain sources.
- Historical statistics for informational purposes only, not financial advice. Results may vary with sample, period, and baseline definition.
Related tests
- Does CPI move the U.S. dollar? — the same release, a different market.
- Which U.S. data releases move the Treasury curve? — how CPI compares to jobs, PPI, PCE and the rest across maturities.
- Do jobs reports (NFP) move Treasury yields? — the one release with an even larger release-day move.
Source
- 10-Year Treasury Constant Maturity, Federal Reserve Board via FRED (Tier A, U.S. public domain) — DGS10.