Does CPI move the U.S. dollar?
Most similar past releases: March 2006, August 2024, March 2025
Reported figure: U.S. government release. Market move: change from the prior close, Federal Reserve Board data via FRED. "Normal day" is that calendar year's average daily move. Browse every release.
CPI is the market's marquee inflation release, and its effect on Treasury yields is one of the clearer results on this site — release-day volatility runs about 1.58× a normal day. A natural follow-up: does that same release move the U.S. dollar? Inflation is supposed to drive rate expectations, and rate expectations are supposed to drive the currency, so the chain seems obvious. We tested it across 37 CPI releases against the broad trade-weighted dollar.
Verdict
- Direction (release day): Not Significant
- Volatility (release day): Not Significant
- Volatility (5 days): Not Significant
CPI moves Treasuries hard, but the dollar only mildly — about 1.3× a normal day (just short of significant). The dollar leaned slightly weaker on CPI days in 2023–2025, but that tilt is not a reliable rule.
Bottom line: For the dollar, CPI is a second-order event — far smaller than its effect on Treasury yields.
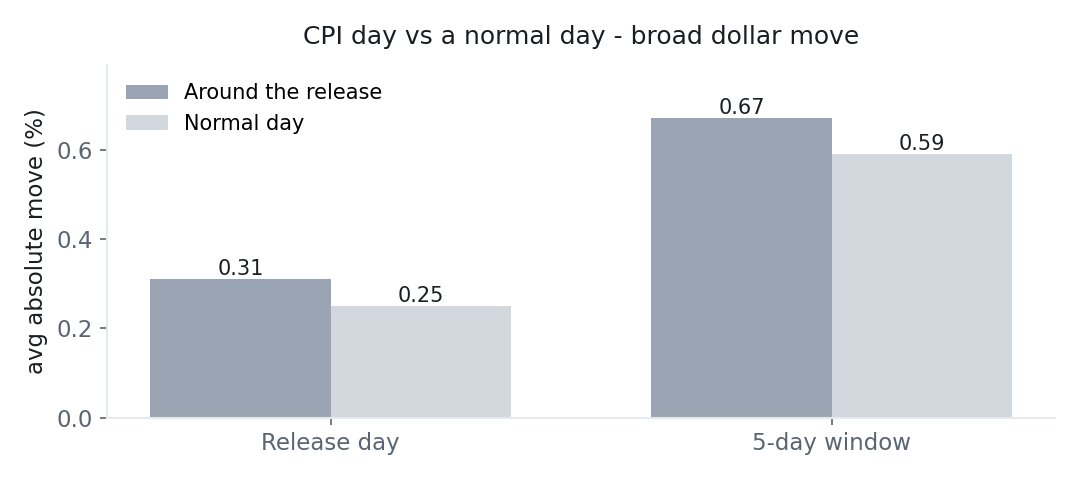
Average absolute broad-dollar move around CPI releases versus normal days (N=37). Chart: Macro or Noise, from Federal Reserve Board data via FRED (public domain).
What the numbers say
On release day, the broad dollar moved about 0.31% versus roughly 0.25% on a normal day — about 1.26× a normal day, which is just short of significant (p=0.06). Compared with the same release's punch on the 10-year Treasury (1.58×, significant on its own), the currency reaction is muted. The transmission from inflation data runs strongly into rates and only weakly into the dollar on the day.
There is also a directional wrinkle worth handling carefully.
The in-sample "dollar leaned weaker" — and why we don't certify it
Across 2023–2025 the dollar averaged about −0.17% on CPI days, and in isolation that looks statistically significant (p=0.009). We do not present it as a reliable rule, for the same reason we flag the FOMC direction result:
- It covers a single policy regime (the disinflation-and-pivot stretch of 2023–2025), with no out-of-sample confirmation.
- Held to a consistent standard — and corrected for the fact that we test many release-and-market pairs — an in-sample-only directional tilt is reported honestly as not robust.
A directional pattern that only exists in one regime is exactly the kind of "false pattern" a disciplined test is meant to strip out. The honest statement is: over this particular window the dollar leaned slightly weaker on CPI days, and we cannot certify that it will keep doing so.
What this means in practice
- CPI is a rates story first, a currency story second. If you care about the market-moving effect of inflation data, the Treasury reaction is where it shows up.
- The dollar's CPI-day move is borderline and undirected. Not a volatility event you can rely on, and not a direction you can trade from the release.
- Ignore the "dollar always falls on CPI" framing. It described 2023–2025; it is not an established rule.
None of this is advice — it is a description of what 37 releases actually did, and results can change with a different sample, period, or definition.
The data
| Dimension | Horizon | Value | Baseline | Test stat | p-value | Verdict |
|---|---|---|---|---|---|---|
| Direction | release day | -0.17% | 0.00% | -2.74 | 0.009 | Not Significant (not robust) |
| Volatility | release day | 0.31% | 0.25% | 1.26 | 0.059 | Not Significant |
| Volatility | 5 days | 0.67% | 0.59% | 1.13 | 0.189 | Not Significant |
Methodology
- Events (N): 37 CPI releases.
- Window: 2023-01-12 → 2025-12-18.
- Measurement: the percentage change in the broad dollar index from the prior close to the close at the end of the holding window (look-ahead protected).
- Baseline: the unconditional distribution of same-length percentage returns across all trading days.
- Tests: one-sample t-test of the signed return against zero (direction), and a bootstrap of the absolute return against the baseline (size).
Caveats
- The in-sample downward tilt covers a single 2023–2025 regime; we do not certify it as robust.
- Compare with our CPI → 10-year Treasury study (a much larger, significant reaction).
- Surprise-versus-forecast conditioning is not applied — only the release-day reaction is measured.
- Historical statistics for informational purposes only, not financial advice. Results may vary with sample, period, and baseline definition.
Related tests
- Does CPI move the 10-year Treasury yield? — the same release, a much larger reaction.
- Does PCE inflation move the U.S. dollar? — the other inflation gauge, an even quieter currency day.
- Do U.S. data releases move the dollar or oil? — the full currency-and-commodity picture.
Source
- Nominal Broad U.S. Dollar Index, Federal Reserve Board via FRED (Tier A, U.S. public domain) — DTWEXBGS.
- CPI release dates, U.S. Bureau of Labor Statistics — Consumer Price Index.