Does a Fed rate decision move Treasury yields?
Eight times a year, the Federal Open Market Committee (FOMC) announces its interest-rate decision at 2:00 p.m. Eastern, followed half an hour later by the Fed chair's press conference. If any scheduled event should move the bond market in a predictable direction, this is the candidate: the Fed sets the policy rate that anchors the entire yield curve, and it tells you what it is doing in plain language.
We measured the 10-year Treasury yield's reaction across 24 FOMC decision days from 2023 to 2025. The finding is a useful lesson in the difference between "big" and "predictable."
Verdict
- Direction (release day): Not Significant
- Volatility (release day): Significant
- Volatility (5 days): Not Significant
On Fed (FOMC) decision days, the 10-year Treasury yield swings about 1.4× a normal day (p=0.04). Yields leaned lower across 2023–2025, but that direction is not a reliable rule.
Bottom line: Fed decision days are big days for bonds — but "big" means volatile, not predictable in direction.
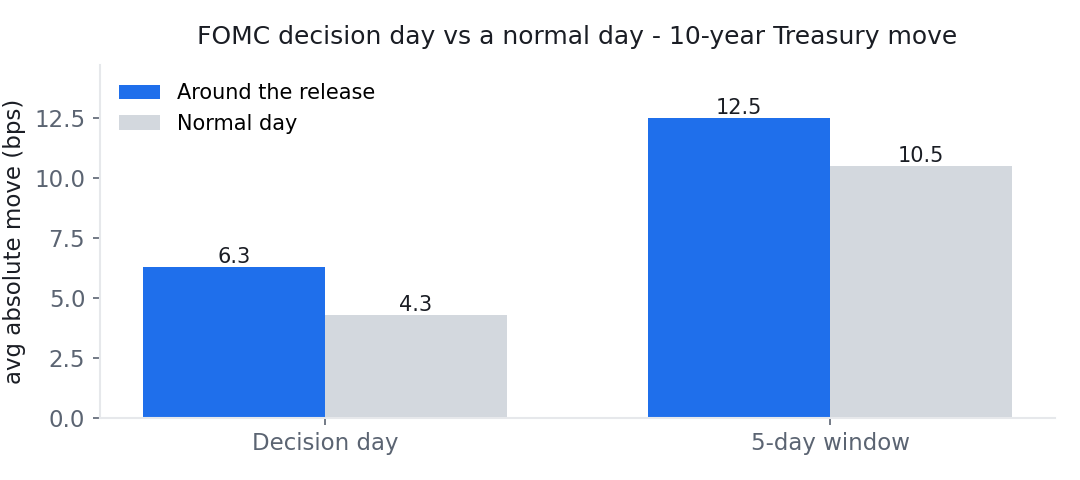
Average absolute 10-year yield move around FOMC decisions versus normal days (N=24). Chart: Macro or Noise, from Federal Reserve Board data via FRED (public domain).
What the numbers say
On decision day, the 10-year yield moved about 6.3 basis points in absolute terms versus 4.3 on a normal day — roughly 1.45× a normal day, significant on its own (p=0.04) though not once corrected across the whole grid. This is the same volatility signature we find on CPI days, arrived at independently. The bond market clearly reacts to the Fed.
Direction is where it gets interesting. Across this 2023–2025 sample, yields averaged −3.8 basis points on FOMC days, and in isolation that looks significant (p=0.01). We deliberately do not promote it to a reliable rule, for two reasons that go to the heart of how we work.
Why we treat the "−3.8 bp" as not robust
- It is a single policy regime. The 2023–2025 window covers one arc — from the end of aggressive hiking into the first cuts. A downward lean over that particular stretch does not mean the same lean holds in a different environment. One regime is not evidence of a repeatable rule.
- It does not survive multiple-comparison correction. When you test many event-and-market combinations, some will look significant by chance. Once we correct for that across our grid, the FOMC-day direction no longer clears the bar. In keeping with our standard, an in-sample directional tilt with no out-of-sample confirmation is reported honestly as not robust — not headlined as a signal.
This is exactly the kind of "too good to be true" directional finding that a disciplined test is meant to catch. The volatility result is robust; the direction is not.
What this means in practice
- Expect a meaningful move, in an unknown direction. FOMC day reliably brings more movement than usual to the 10-year — but the decision itself does not give you a dependable direction to trade.
- Beware regime-specific stories. "Yields fall on Fed day" happened to describe 2023–2025. Extending that into a rule is precisely the mistake this site exists to flag.
- The move is concentrated on the day. By a week out, the volatility edge has faded.
None of this is advice — it is a description of what 24 decisions actually did, and results can change with a different sample, period, or definition.
The data
| Dimension | Horizon | Value | Baseline | Test stat | p-value | Verdict |
|---|---|---|---|---|---|---|
| Direction | release day | -3.8 bps | 0.0 bps | -2.79 | 0.010 | Not Significant (not robust) |
| Volatility | release day | 6.3 bps | 4.3 bps | 1.45 | 0.04 | Nominal only |
| Volatility | 5 days | 12.5 bps | 10.5 bps | 1.19 | 0.167 | Not Significant |
Methodology
- Events (N): 24 FOMC decisions.
- Window: 2023-02-01 → 2025-12-10.
- Measurement: change in the 10-year yield from the prior close to the close at the end of the holding window (look-ahead protected).
- Baseline: the unconditional distribution of same-length moves across all trading days.
- Tests: one-sample t-test of the signed move against zero (direction), and a bootstrap of the absolute move against the baseline (size), with multiple-comparison correction applied across our event-market grid.
Caveats
- The rate-sensitive 2-year Treasury shows a similar but borderline pattern (direction p=0.05).
- Direction results cover a single 2023–2025 policy regime; another regime could differ.
- Surprise-versus-expectations conditioning is not applied — only the release-day reaction is measured.
- Historical statistics for informational purposes only, not financial advice. Results may vary with sample, period, and baseline definition.
Related tests
- Does CPI move the 10-year Treasury yield? — the inflation side of the Fed's mandate.
- Do jobs reports (NFP) move Treasury yields? — the labor side.
- Which U.S. data releases move the Treasury curve? — the full comparison, with multiple-testing correction.
Source
- 10-Year Treasury Constant Maturity, Federal Reserve Board via FRED (Tier A, U.S. public domain) — DGS10.
- FOMC meeting dates, Federal Reserve Board — FOMC calendar.