Do retail sales move Treasury yields?
Most similar past releases: September 2008, January 2014, April 2025
Reported figure: U.S. government release. Market move: change from the prior close, Federal Reserve Board data via FRED. "Normal day" is that calendar year's average daily move. Browse every release.
The monthly retail-sales report is the market's main read on the U.S. consumer, who drives most of the economy. It gets real attention on release, and a strong or weak print is often cited as a reason yields moved that day. We put that story to the test across 38 retail-sales releases against the 10-year Treasury yield.
Verdict
- Direction (release day): Not Significant
- Volatility (release day): Not Significant
- Volatility (5 days): Not Significant
Retail sales barely move the 10-year Treasury — about 1.3× a normal day, just short of statistically significant (p=0.05), with no consistent direction.
Bottom line: Retail sales is a second-tier release for bonds — a hint of extra movement, but not a reliable mover.
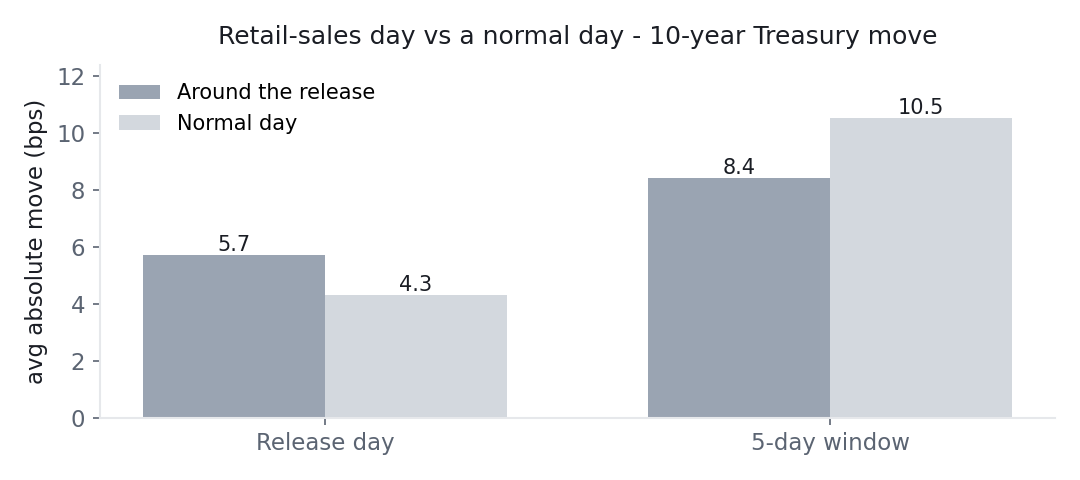
Average absolute 10-year yield move around retail-sales releases versus normal days (N=38). Chart: Macro or Noise, from Federal Reserve Board data via FRED (public domain).
What the numbers say
On release day, the 10-year yield moved about 5.7 basis points versus 4.3 on a normal day — roughly 1.32× a normal day. That is just short of the significance threshold (p=0.05), which is exactly why it lands in "not significant" rather than "significant." It is a borderline result: there may be a small real effect, but it is not one we can confidently distinguish from noise. Direction is a clear wash (about −0.8 basis points, p=0.47), and there is no lasting move over a five-day window.
What "borderline" honestly means
It would be easy to round 1.32× up to "retail sales moves bonds." We don't, and the reason is central to how this site works. A p-value of 0.05 sitting right on the line is precisely where wishful analysis creeps in — it is tempting to call it a hit. Held to a consistent standard, and especially once you account for the fact that we are testing many releases at once, a single borderline result is better described as not established. If retail sales has a real effect on the 10-year, it is small enough that 38 releases cannot pin it down.
You can see how retail sales compares to the releases that do clear the bar — CPI and the jobs report — on our Treasury curve map.
What this means in practice
- A minor bond release. Retail sales adds, at most, a modest amount of movement to the 10-year, and even that is not statistically established.
- No tradable direction. The signed reaction is indistinguishable from zero.
- Don't over-read a borderline number. "Just short of significant" is a real finding: not established, not a green light.
None of this is advice — it is a description of what 38 releases actually did, and results can change with a different sample, period, or definition.
Key findings, generated from the data
- Across 342 releases, the 10Y moved an average of 5.17 bps on release day (absolute).
- The largest single reaction was +29.0 bps on 2020-03-17 (February 2020 data).
- Pooled across all 342 releases since 2000, readings above trend moved the 10Y +1.1 bps versus -0.9 bps below trend (p=0.006). But that pooled result does not reproduce across eras — 2000-2012: +2.71 (p=0.01); 2013-2019: +0.12 (p=0.92); 2020-2026: +2.31 (p=0.13). It is concentrated in one period rather than being a stable relationship, so we report it as regime-dependent, not established.
- Because our surprise is a trend proxy rather than a market consensus, and because these splits are sensitive to the period chosen, treat all of the above as patterns observed in this sample rather than as established effects.
- Bigger surprises do produce bigger moves: the largest third of surprises averaged 5.77 versus 4.36 for the smallest third (p=0.018).
Generated automatically from our event database by a rule-based script (no language model). "Surprise" is model-based — the reading minus the average of the previous three — and is not a market consensus forecast. See every release in the database.
The data
| Dimension | Horizon | Value | Baseline | Test stat | p-value | Verdict |
|---|---|---|---|---|---|---|
| Direction | release day | -0.8 bps | 0.0 bps | -0.74 | 0.466 | Not Significant |
| Volatility | release day | 5.7 bps | 4.3 bps | 1.32 | 0.052 | Not Significant |
| Volatility | 5 days | 8.4 bps | 10.5 bps | 0.81 | 0.883 | Not Significant |
Methodology
- Events (N): 38 retail-sales releases.
- Window: 2023-01-18 → 2025-12-16.
- Measurement: change in the 10-year yield from the prior close to the close at the end of the holding window (look-ahead protected).
- Baseline: the unconditional distribution of same-length moves across all trading days.
- Tests: one-sample t-test of the signed move against zero (direction), and a bootstrap of the absolute move against the baseline (size).
Caveats
- The release-day reaction is borderline (×1.32, p=0.05) — not quite significant.
- The event study above does not condition on surprise: it measures the reaction to the release itself. The "Key findings" block does add a split by our own trend-based proxy, which is not a market consensus forecast — consensus data is proprietary and outside our public-domain sources.
- Historical statistics for informational purposes only, not financial advice. Results may vary with sample, period, and baseline definition.
Related tests
- Do jobs reports (NFP) move Treasury yields? — a first-tier release, for contrast.
- Do weekly jobless claims move Treasury yields? — another labor-and-consumer read.
- Which U.S. data releases move the Treasury curve? — retail sales in context.
Source
- 10-Year Treasury Constant Maturity, Federal Reserve Board via FRED (Tier A, U.S. public domain) — DGS10.
- Advance Monthly Retail Sales release dates, U.S. Census Bureau — Advance Monthly Retail Sales.