Does GDP move Treasury yields?
Gross Domestic Product is the broadest measure of the U.S. economy, and its quarterly release gets headline treatment. But GDP has a feature that sets it apart from monthly data: it describes a quarter that has already ended, and it arrives after most of the monthly indicators that feed into it are already known. That raises a natural question for the bond market — is there any new information left in GDP by the time it prints? We tested the 10-year Treasury yield's reaction across 12 quarterly advance estimates.
Verdict
- Direction (release day): Not Significant
- Volatility (release day): Not Significant
- Volatility (5 days): Not Significant
GDP measures the previous quarter — and by the time it lands, the market already knows. On GDP-release days the 10-year Treasury yield moves about as much as a normal day (1.1×, not significant), with no consistent direction.
Bottom line: GDP is backward-looking — the quarter is already over and well-estimated, so Treasuries barely react.
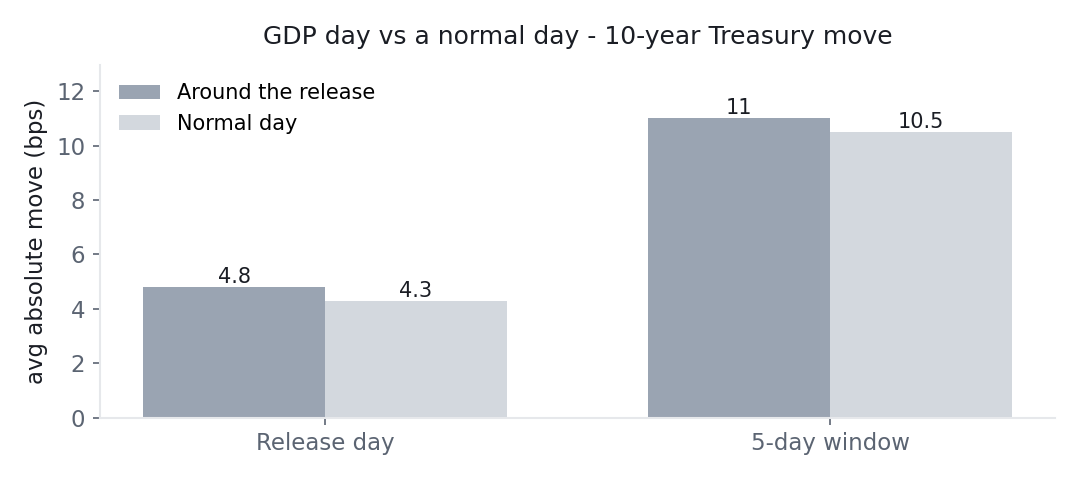
Average absolute 10-year yield move around GDP advance estimates versus normal days (N=12, low sample). Chart: Macro or Noise, from Federal Reserve Board data via FRED (public domain).
What the numbers say
On release day, the 10-year yield moved about 4.8 basis points versus 4.3 on a normal day — roughly 1.12× a normal day, which is not statistically significant (p=0.30). Direction is a wash as well (about +1.7 basis points, p=0.39). Over a five-day window there is no elevation either. On every dimension, GDP day looks like an ordinary day for the 10-year.
The rate-sensitive 2-year moves a little more (about 1.37×), but even that does not clear the significance bar in this sample.
Why a "top-tier" number barely registers
Two things work against GDP as a market mover, and both are informative:
- It is backward-looking and well-anticipated. By the time the advance estimate lands, the market has already seen three months of jobs, inflation, retail sales and more. GDP largely stitches those together, so it rarely contains a surprise big enough to reprice the curve.
- The market-moving version is the advance estimate. We test the first (advance) release, which is the one traders react to. The later second and third revisions move yields even less — they are updates to old news.
As with PCE, the lesson is that a release moves markets in proportion to the new information it carries, not its headline importance.
A note on sample size
Only 12 quarterly advance estimates fall in our 2023–2025 window, so this test has less statistical power than our monthly studies — a modest real effect could go undetected. We report the low sample honestly rather than overstating a "no effect" conclusion; what we can say is that no reaction large enough to detect showed up in these 12 releases.
What this means in practice
- GDP day is, on the evidence so far, a non-event for the 10-year. It moves about like a normal day.
- Backward-looking data carries less market punch. The story was mostly told by the monthly numbers already.
- Read this one with its small sample in mind. Twelve observations is a real result but a modest one.
None of this is advice — it is a description of what 12 releases actually did, and results can change with a different sample, period, or definition.
The data
| Dimension | Horizon | Value | Baseline | Test stat | p-value | Verdict |
|---|---|---|---|---|---|---|
| Direction | release day | 1.7 bps | 0.0 bps | 0.90 | 0.388 | Not Significant |
| Volatility | release day | 4.8 bps | 4.3 bps | 1.12 | 0.295 | Not Significant |
| Volatility | 5 days | 11.0 bps | 10.5 bps | 1.05 | 0.383 | Not Significant |
Methodology
- Events (N): 12 GDP advance estimates.
- Window: 2023-01-26 → 2025-12-23.
- Measurement: change in the 10-year yield from the prior close to the close at the end of the holding window (look-ahead protected).
- Baseline: the unconditional distribution of same-length moves across all trading days.
- Tests: one-sample t-test of the signed move against zero (direction), and a bootstrap of the absolute move against the baseline (size).
Caveats
- Only 12 quarterly advance estimates fall in this window (2023–2025), so statistical power is limited — a modest real effect could go undetected.
- Uses advance (first) estimates only — the market-moving release; later revisions move yields even less.
- Surprise-versus-forecast conditioning is not applied — only the release-day reaction is measured.
- Historical statistics for informational purposes only, not financial advice. Results may vary with sample, period, and baseline definition.
Related tests
- Do jobs reports (NFP) move Treasury yields? — the monthly data that GDP summarizes.
- Does CPI move the 10-year Treasury yield? — a forward-looking release, for contrast.
- Which U.S. data releases move the Treasury curve? — GDP against everything else.
Source
- 10-Year Treasury Constant Maturity, Federal Reserve Board via FRED (Tier A, U.S. public domain) — DGS10.
- GDP (advance estimate) release dates, U.S. Bureau of Economic Analysis — Gross Domestic Product.